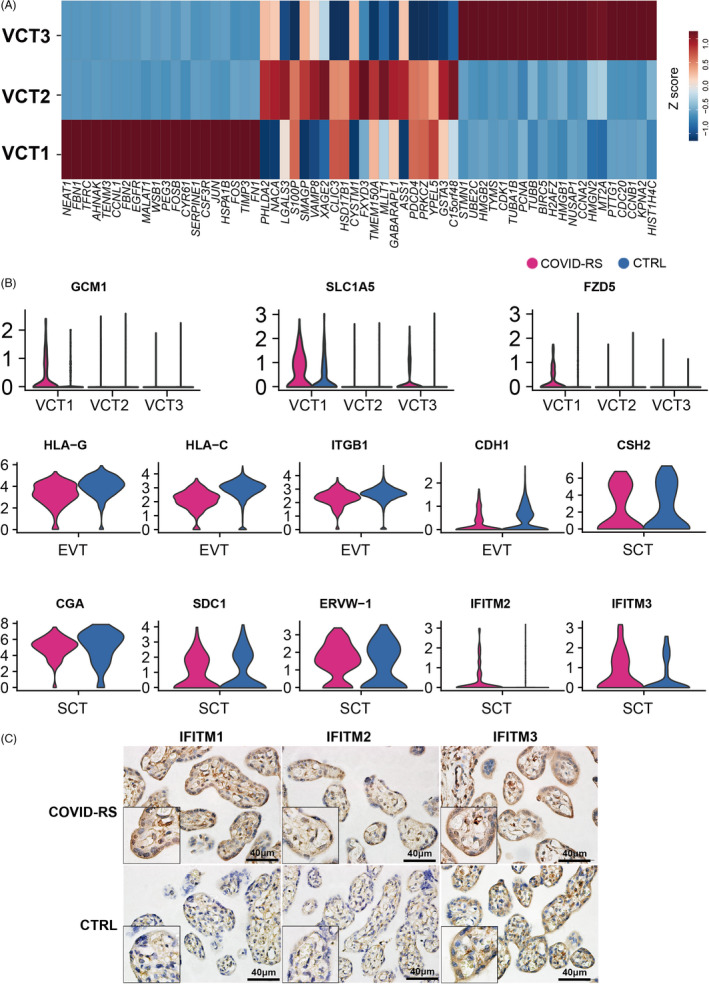
FIGURE 3.

Data analysis indicating impaired trophoblast function in COVID‐RS placenta. (A) Z‐score evaluation showing the expression pattern of the top 20 genes in VCT subsets; (B) Violin plot showing the differential expression of several function‐related genes in VCT, EVT and SCT subsets between COVID‐RS and CTRL placenta; (C) immunohistochemistry for IFITM1, IFITM2 and IFITM3 in the placentas from COVID‐RS and CTRL cases
