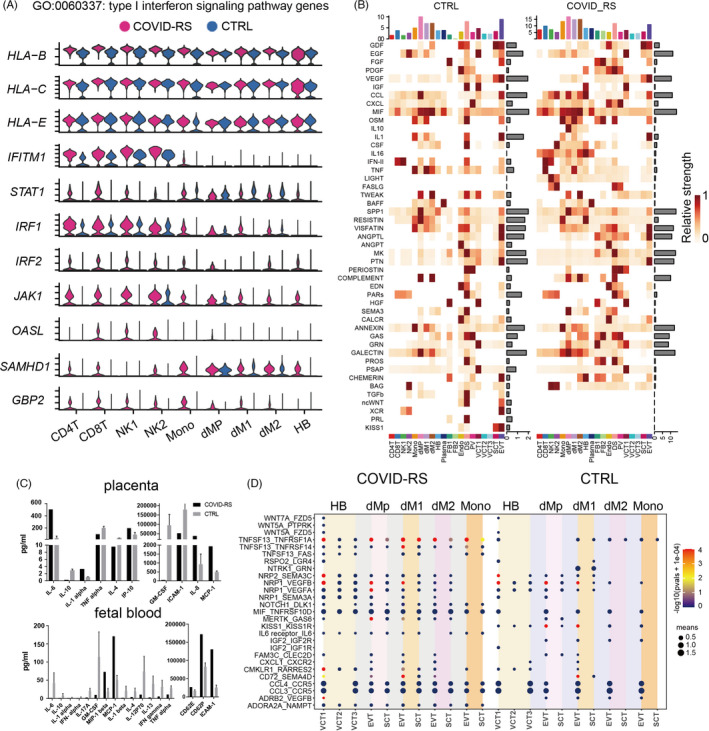
FIGURE 4.

Analysis of sc‐RNAseq data indicates the inflammation response in the COVID‐RS placenta. (A) Violin plot showing the expression of IFN signalling‐related genes in immune cell subsets from COVID‐RS and CTRL placenta; (B) the signalling pathway analyses by Cellchat in all cell subsets from COVID‐RS and CTRL placenta; (C) the cytokine/chemokine profile in the placenta tissues and umbilical cord blood samples from COVID‐RS and CTRL cases; (D) CellphoneDB analysis showing the ligand–receptor interactions among macrophage, monocytes and trophoblast subsets in COVID‐RS and CTRL cases. The size of dots represents mean value and the colour shows −log(pvals +1e‐04)
