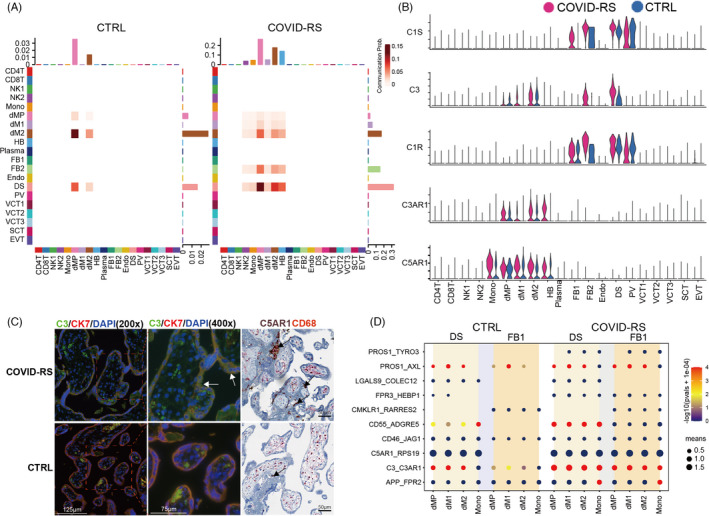
FIGURE 5.

Data analysis showing complement over‐activation in COVID‐RS placenta. (A) Cellchat analysis showing complement signalling networks among different cell subsets in COVID‐RS and CTRL cases. The Receiver and Sender are listed at X and Y axis respectively; (B) Violin plot showing the expression of several critical ligand–receptor pairs in the complement pathway, including C1R, C1S, C3, C3AR1 and C5AR1, in all subsets from COVID‐RS and CTRL placenta; (C) Immunofluorescence or immunohistochemistry showing the activated C3 deposition in the COVID‐RS placenta. Villous trophoblasts and macrophages are labelled by the staining for CK7 and CD68 respectively. The black arrows shows the accumulation of C5aR1‐expressing macrophages; (D) CellphoneDB analysis showing the complement activation–related ligand–receptor pairs among subsets in COVID‐RS and CTRL placenta. The size of dots represents mean value, and the colour shows −log(pvals +1e‐04)
