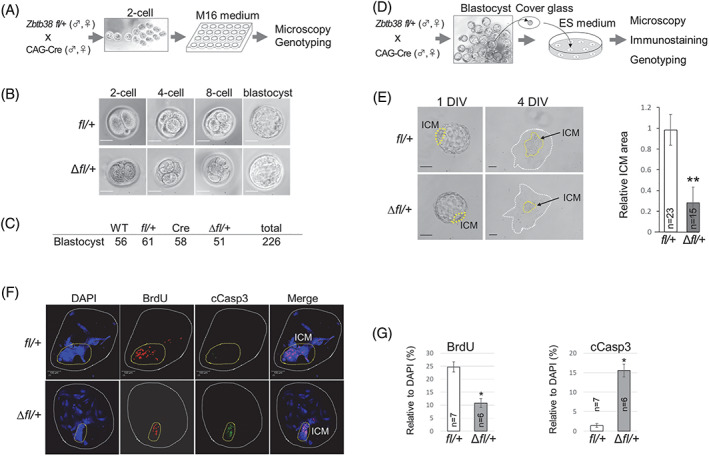
FIGURE 5.

Effects of heterozygous loss of Zbtb38 on pre‐ and peri‐implantation development in vitro. (A–C) Heterozygous loss of Zbtb38 does not affect preimplantation development. (A) Illustration of the two‐cell embryo to the blastocyst in vitro culture. (B) Bright‐field microscopy of two‐cell embryo to the blastocyst stage. (C) Genotypes of blastocysts at day 4 were determined by PCR. (D–G) Heterozygous loss of Zbtb38 suppresses inner cell mass (ICM) outgrowth. (D) Schematic diagram of embryo outgrowth in vitro. (E) Bright‐field microscopy of cultured blastocysts at 1 DIV and 4 DIV is shown (left panel). Yellow dashed lines denote ICM. Scale bar: 100 μm. Right panel, quantitative evaluation of relative ICM area (ICM/TE area). Images were analysed using ImageJ software. The data were representative of five independent experiments, and error bars indicate ± S.D. **p < 0.01. (F) Confocal immunofluorescence images of BrdU‐labelled and cCasp3‐positive cells of 4 DIV embryos. DNA was counterstained with DAPI. Yellow dashed lines denote ICM. Scale bar, 100 μm. (G) Quantitative analysis of the number of BrdU‐positive cells (left) or cCasp3‐positive cells (right) relative to the total number of nuclei (DAPI‐positive cells) from the indicated numbers of representative embryos. Error bars represent ± S.D. *p < 0.05
