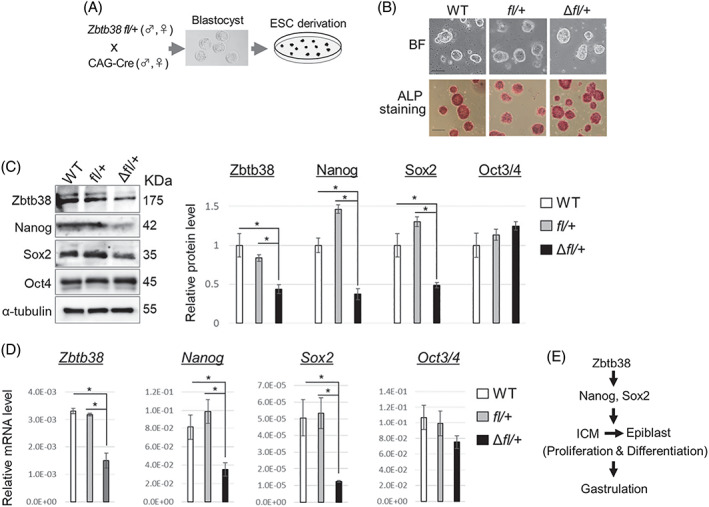
FIGURE 7.

Establishment of embryonic stem (ES) cell clones and expressions of genes in ES cells. (A) Schematic diagram showing the derivation of ES cells‐ from blastocysts. (B) Bright‐field images of typical ES cell colonies (top) which show compact colonies with distinct borders and well‐defined edges, and alkaline phosphatase staining (bottom) of ES cells‐. Scale bar, 100 μm. (C and D) loss of a single Zbtb38 allele in ES cells leads to a reduced expression of Nanog, Sox2 in ES cells. Expressions of the indicated proten‐ (C) and ‐mRNA in (D) from ES cells. GAPDH and α‐tubulin were used as internal controls for qRT‐PCR and immunoblotting, respectively. Data shown are representative of three independent experiments, and error bars indicate ± S.D. *p < 0.05. (E) Schematic model of how Zbtb38 affects gastrulation
