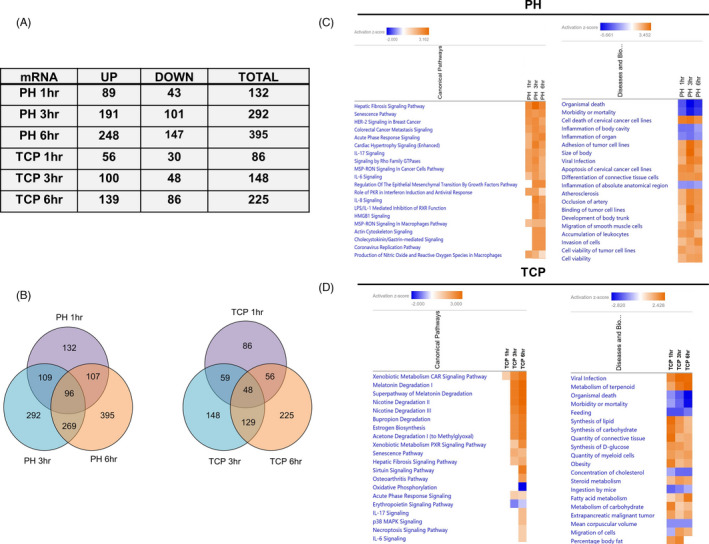
FIGURE 2.

Ingenuity Pathway Analysis of deregulated genes after PH or TCP treatment. (A) Table showing the number of genes up‐ or downregulated at 1, 3 and 6 h post‐PH and TCP treatment; (B) Venn diagrams showing the number of deregulated and overlapping genes at 1, 3 and 6 h post‐PH or TCP treatment; (C) Heatmap for top 20 canonical pathways and diseases and biological function at 1, 3 and 6 h post‐PH. Colour is determined by Z‐score; the Z‐score >2 and <−2 is considered significant. Blue colour indicates suppressed disease /biological function or canonical pathways; orange indicates activated disease/biological function or canonical pathways; (D) Heatmap for top 20 canonical pathways and diseases and biological functions at 1, 3 and 6 h post‐TCP. Colour is determined by Z‐score; the Z‐score >2 and <−2 are considered significant. Blue colour indicates suppressed disease /biological function or canonical pathways; orange indicates activated disease/biological function or canonical pathways
