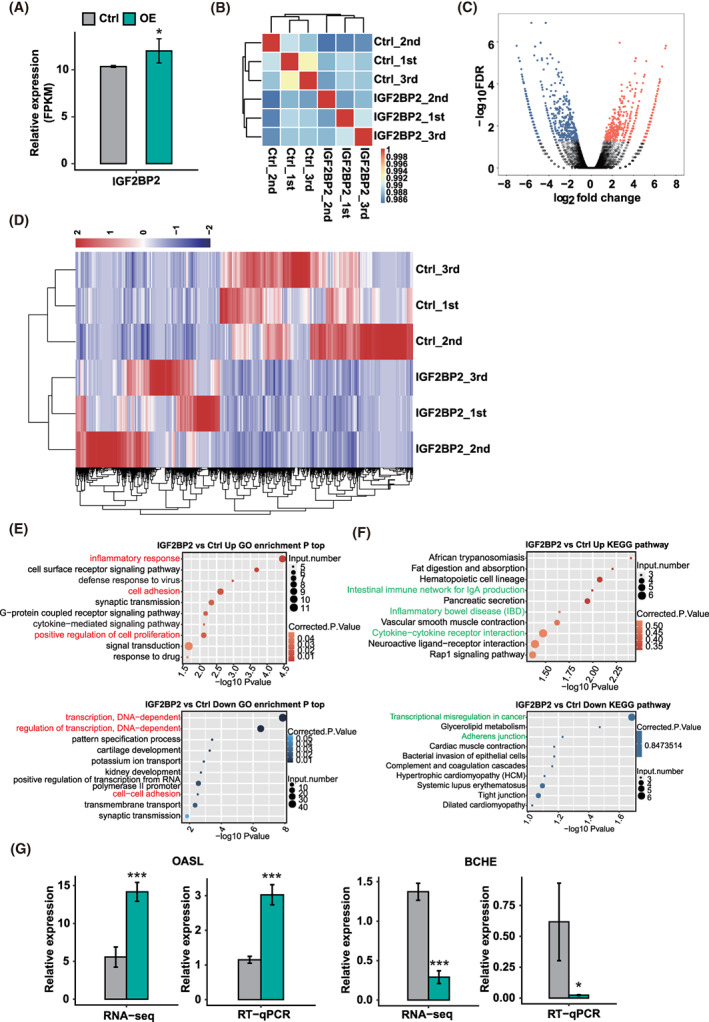
FIGURE 2.

RNA‐seq analysis of insulin‐like growth factor 2 mRNA‐binding protein 2 (IGF2BP2) regulated transcriptome profile in KGN cells. (A) IGF2BP2 expression quantified by RNA‐seq data. Fragments per kilobase of transcript per million fragments mapped (FPKM) values were calculated following the described in Section 2. Error bars represent the mean ± SEM. *P < 0.05. (B) Heat map showing a hierarchically clustered Pearson's correlation matrix resulting from the comparison between transcript expression levels for control and IGF2BP2‐overexpressed samples. (C) Identification of IGF2BP2‐regulated genes. Volcano plot shows up‐ and down‐regulated genes labelled in red and blue, respectively. (D) Hierarchical clustering of differentially expressed genes (DEGs) in control and IGF2BP2‐overexpressed samples. FPKM values were log2‐transformed and then median‐centred by each gene. (E) The top 10 GO biological processes of IGF2BP2 up‐ and down‐regulated genes. (F) The top 10 KEGG pathways of IGF2BP2 up‐ and down‐regulated genes. (G) The relative expression of DEGs and qPCR validation. Error bars represent the mean ± SEM. ***P < 0.001, *P < 0.05
