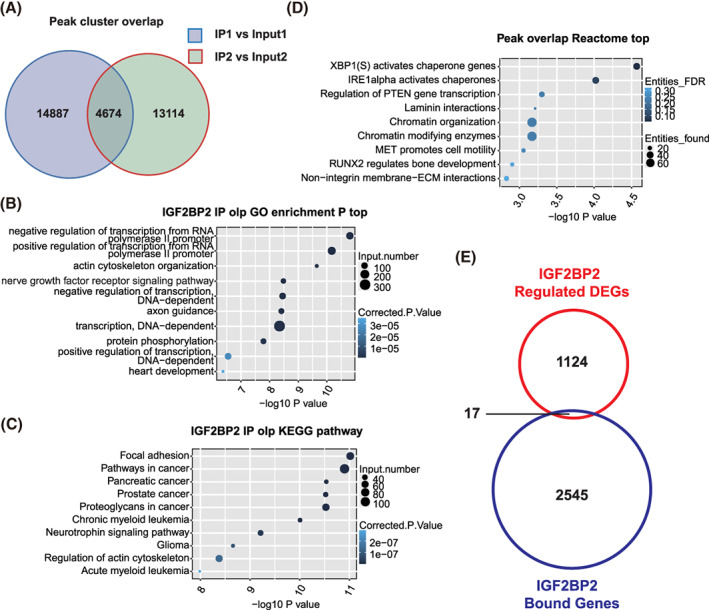
FIGURE 4.

Differentially expressed genes (DEGs) regulated by insulin‐like growth factor 2 mRNA‐binding protein 2 (IGF2BP2) overexpression showed no direct bindings of IGF2BP2. (A) Venn diagram showing the overlap between peaks in two RNA immunoprecipitation sequencing (RIP‐seq) sample replicates. (B) Bubble plot showing the top 10 biological processes associated with IGF2BP2‐bound genes using a GO enrichment analysis. (C) Bubble plot showing the top 10 biological processes associated with IGF2BP2‐bound genes using a KEGG enrichment analysis. (D) Bubble plot showing the top 10 pathways associated with IGF2BP2‐bound genes using a reactome enrichment analysis. (E) Venn diagram showing genes overlapping between RIP‐seq and DEGs
