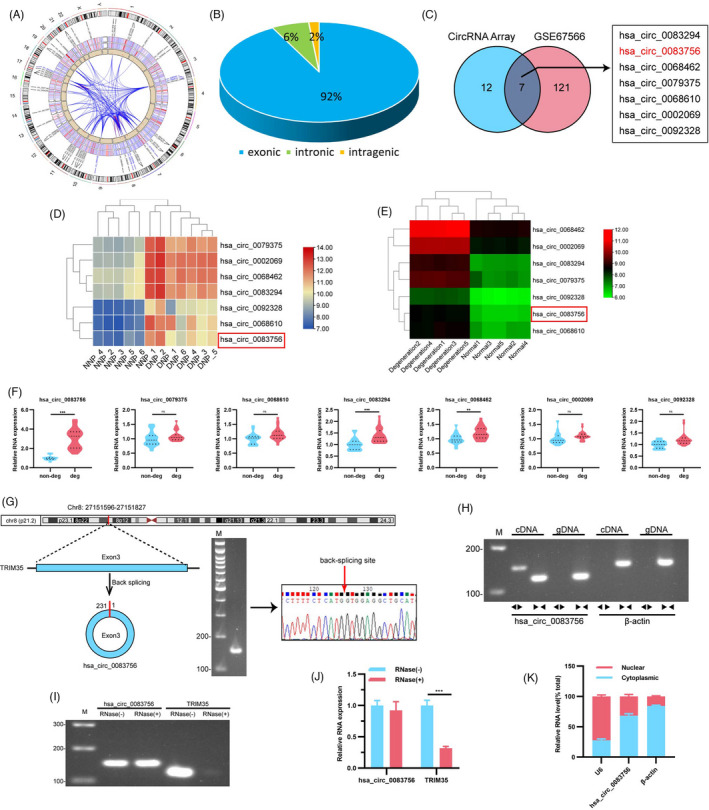
FIGURE 1.

Expression profiles of circRNAs in non‐degenerated and degenerated NP tissues. (A) Circos plot displayed the distribution and expression of circRNAs on human chromosomes in our circRNA Array. The outermost layer was a chromosome map of the human genome. The inner circles from outside to inside corresponded to differentially expressed circRNAs, a heatmap of all circRNAs, a scatter plot and a cross‐link of differentially expressed circRNAs. (B) Constituent ratios of differentially expressed circRNAs. (C) Venn diagram demonstrating the overlap of circRNAs in the circRNA Array (right) and GSE67566 (left). (D, E) Hierarchical cluster analysis of the seven circRNAs in the circRNA Array and GSE67566 data sets. (F) Expression of the seven cirRNAs in non‐degenerated and degenerated NP tissues was measured using RT‐qPCR; n = 10 for non‐degenerated NP tissues and n = 14 for degenerated NP tissues. (G) Schematic illustration demonstrating the circularization of TRIM35 exon 3 to form circ‐83756. The presence of circ‐83756 was validated by RT‐PCR, followed by agarose gel electrophoresis and sanger sequencing. The red arrow represents the head‐to‐tail splicing site of circ‐83756. (H) RT‐PCR validated the existence of circ‐83756, which was amplified by divergent primers in cDNA but not gDNA; β‐actin was used as control. (I, J) The expressions of circ‐83756 and TRIM35 mRNA were detected by RT‐qPCR in the presence or absence of RNase R. (K) Expression levels of cytoplasmic control transcripts (β‐actin), the nuclear control transcript (U6) and circ‐83756 were determined by RT‐qPCR in the cytoplasmic and nuclear fractions of NP cells. **p < 0.01 and ***p < 0.001 vs. the indicated group; ns: no significant; statistical data were presented as mean ±SEM; IVDD, intervertebral disc degeneration
