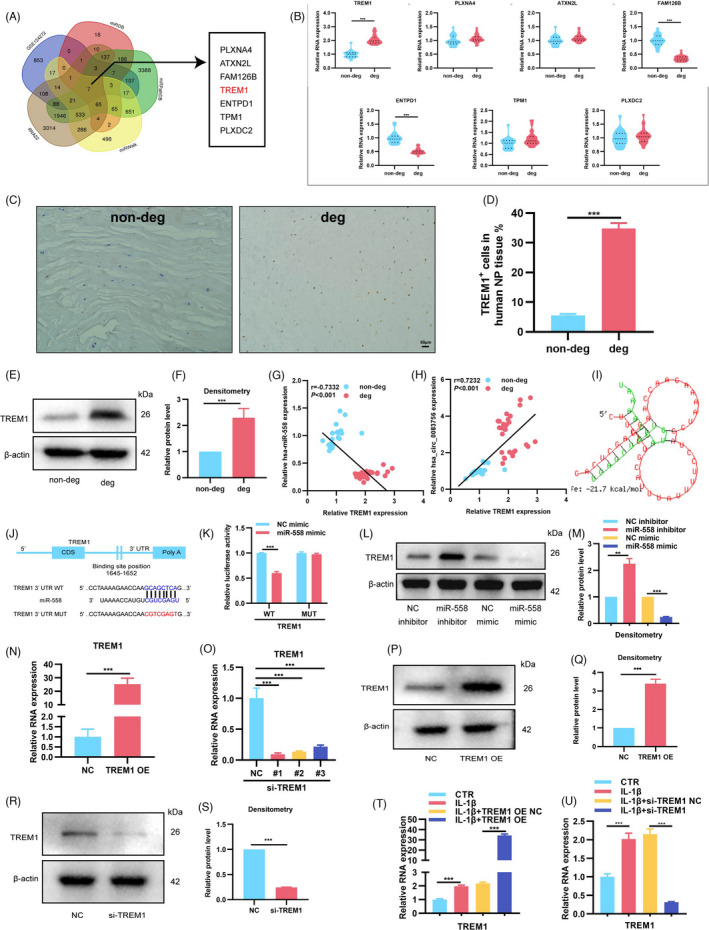
FIGURE 6.

TREM1 was the target gene of miR‐558. (A) Venn diagram demonstrated the intersection of predicted potential target mRNAs of miR‐558 using the miRDB, miRPathDB, miRWalk and RNA22 databases, as well as the GSE124272 data set; there were seven candidate genes. (B) RT‐qPCR was used to detect the expressions of these seven candidate genes and TREM1 increased highest in degenerated NP tissues; n = 10 for non‐degenerated NP tissues and n = 14 for degenerated NP tissues. (C–F) IHC staining and WB showed that the expressions of TREM1 were upregulated in degenerated NP tissues. (G, H) Correlation analysis demonstrated that the expression of TREM1 was significantly positively correlated with circ‐83756 but negatively correlated with miR‐558 expression. (I) General structure diagram showing the binding sites of TREM1 to miR‐558 analysed by the bioinformatics programs and RNAhybrid. (J) Sequence alignment of human miR‐558 and the 3′‐UTR region of TREM1 mRNA. Bottom: mutations in the 3′‐UTR region of TREM1 to create mutant luciferase reporter constructs. (K) Luciferase reporter assay showed the luciferase activities of Luc‐TREM1 WT and Luc‐TREM1 MUT in T293 cells co‐transfected with miR‐NC or miR‐558 mimic. (L, M) WB showed that the expression of TREM1 was elevated by the miR‐558 inhibitor and suppressed by the miR‐558 mimic. (N, O) RT‐qPCR evaluated the expressions of TREM1 in NP cells transfected with TREM1 OE plasmid or three different TREM1 siRNAs. (P–S) WB showed that TREM1 OE can significantly upregulate the expression of TREM1, whereas si‐TREM1 decreases the expression of TREM1. (T, U) NP cells treated with IL‐1β were transfected with TREM1 OE or si‐TREM1, and TREM1 levels were detected by RT‐qPCR. **p < 0.01 and ***p < 0.001 vs. the indicated group. Statistical data are presented as mean ±SEM; IVDD, intervertebral disc degeneration; WT, wild type; MUT, mutant type
