
FIGURE 3.
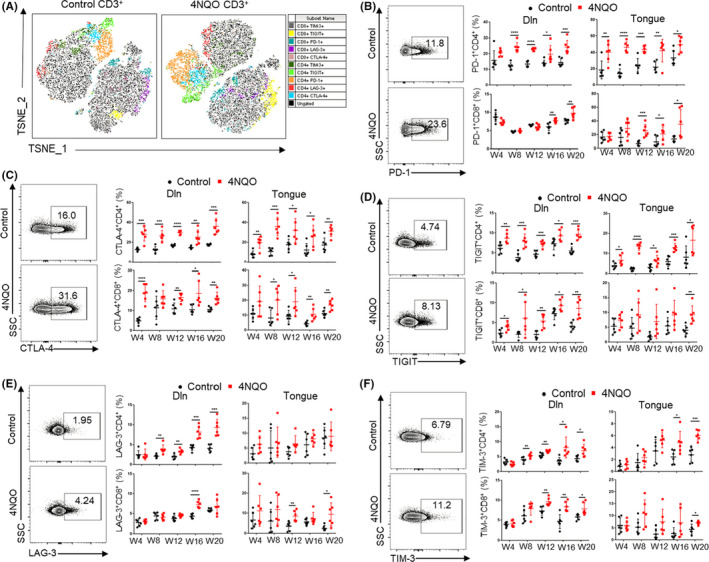
Expression of inhibitory receptors on T cells increased gradually with the development of OSCC. (A) T‐SNE plots of inhibitory receptors expression on T cells in control and 4NQO mice. The parameters including CD4, CD8, PD‐1, CTLA‐4, TIGIT, LAG‐3, and TIM‐3 were incorporated in the analysis. (B, C, D, E, and F) Expression of PD‐1 (B), CTLA‐4 (C), TIGIT (D), LAG‐3 (E), and TIM‐3 (F) on T cells in Dln and tongue during the development of OSCC. W4, week 4; W8, week 8; W12, week 12; W16, week 16; W20, week 20. *p < 0.05, **p < 0.01, ***p < 0.001, ****p < 0.0001