. 2020 Aug 10;10(49):29347–29361. doi: 10.1039/d0ra05015f

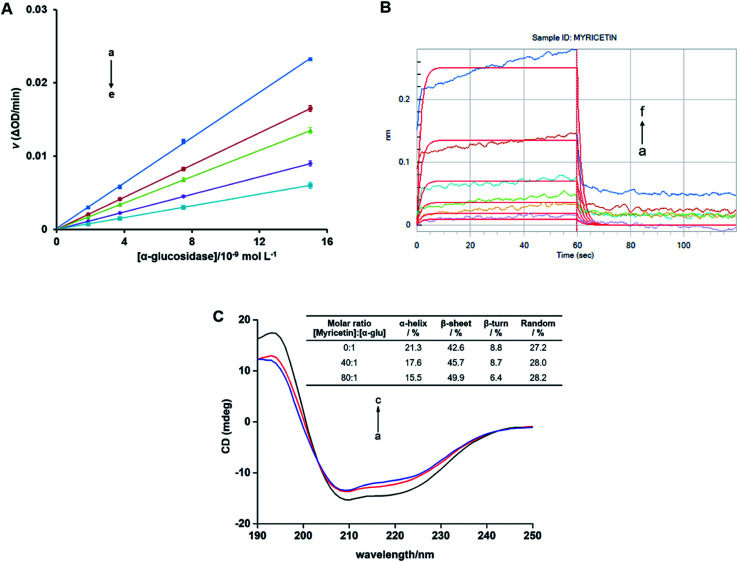
Fig. 8. (A) Plots of v vs. [α-glucosidase]. c(pNPG) = 3.13 × 10⁻⁴ mol L−1. Myricetin concentrations were 0, 0.78, 1.56, 3.13, 6.25 × 10⁻⁵ mol L−1 for curves a→e, respectively. (B) Binding kinetic analysis for the interaction of myricetin with α-glucosidase by bio-layer interferometry (BLI). c(myricetin) = (0.16, 0.31, 0.63, 1.25, 2.50, 5.00) × 10−4 mol L−1 for curves a→f. The red vertical line at 60 s marks the start of dissociation of the compound from the sensor surface. (C) Circular Dichroism (CD) spectra of α-glucosidase in the presence of increasing amounts of myricetin. c(α-glucosidase) = 2.01 × 10⁻⁶ mol L−1, the molar ratios of myricetin to α-glucosidase were 0 : 1 (a), 40 : 1 (b), 80 : 1 (c), respectively.

Fig. 8