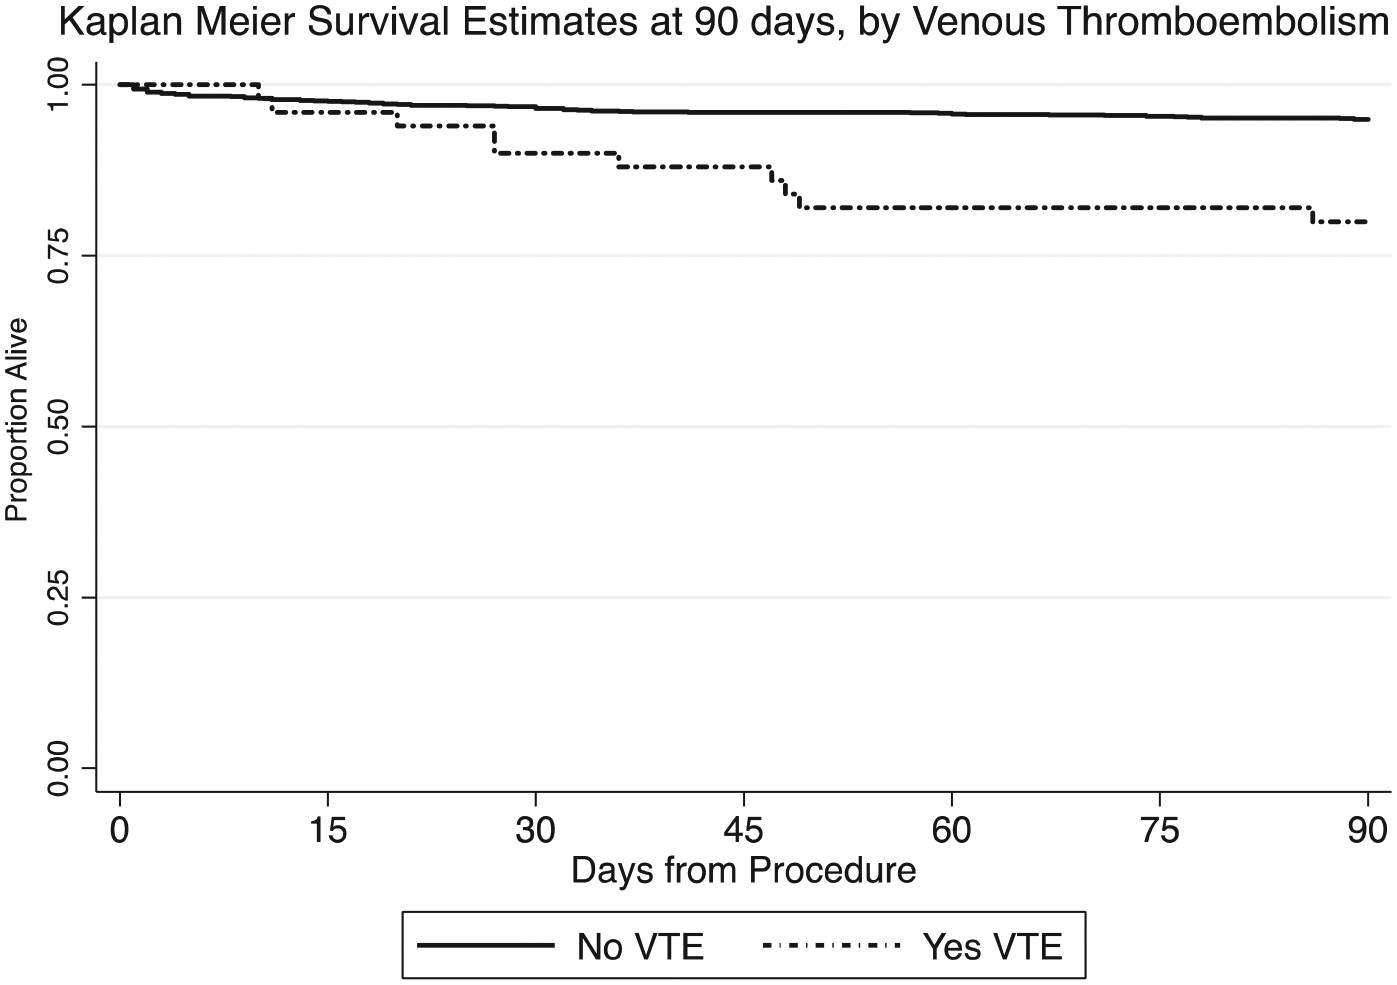
Fig 3.

Kaplan-Meier curves comparing survival ≤90 days for those with and without postoperative venous thromboembolism (VTE). Solid line indicates no VTE group (n = 1400; deaths, n = 67); dotted line, VTE group (n = 49; deaths, n = 10). Adjusted hazard ratio for VTE was 2.8 (P = .01). The results from the full Cox proportional hazard model are presented in Supplementary Table II (online only).
