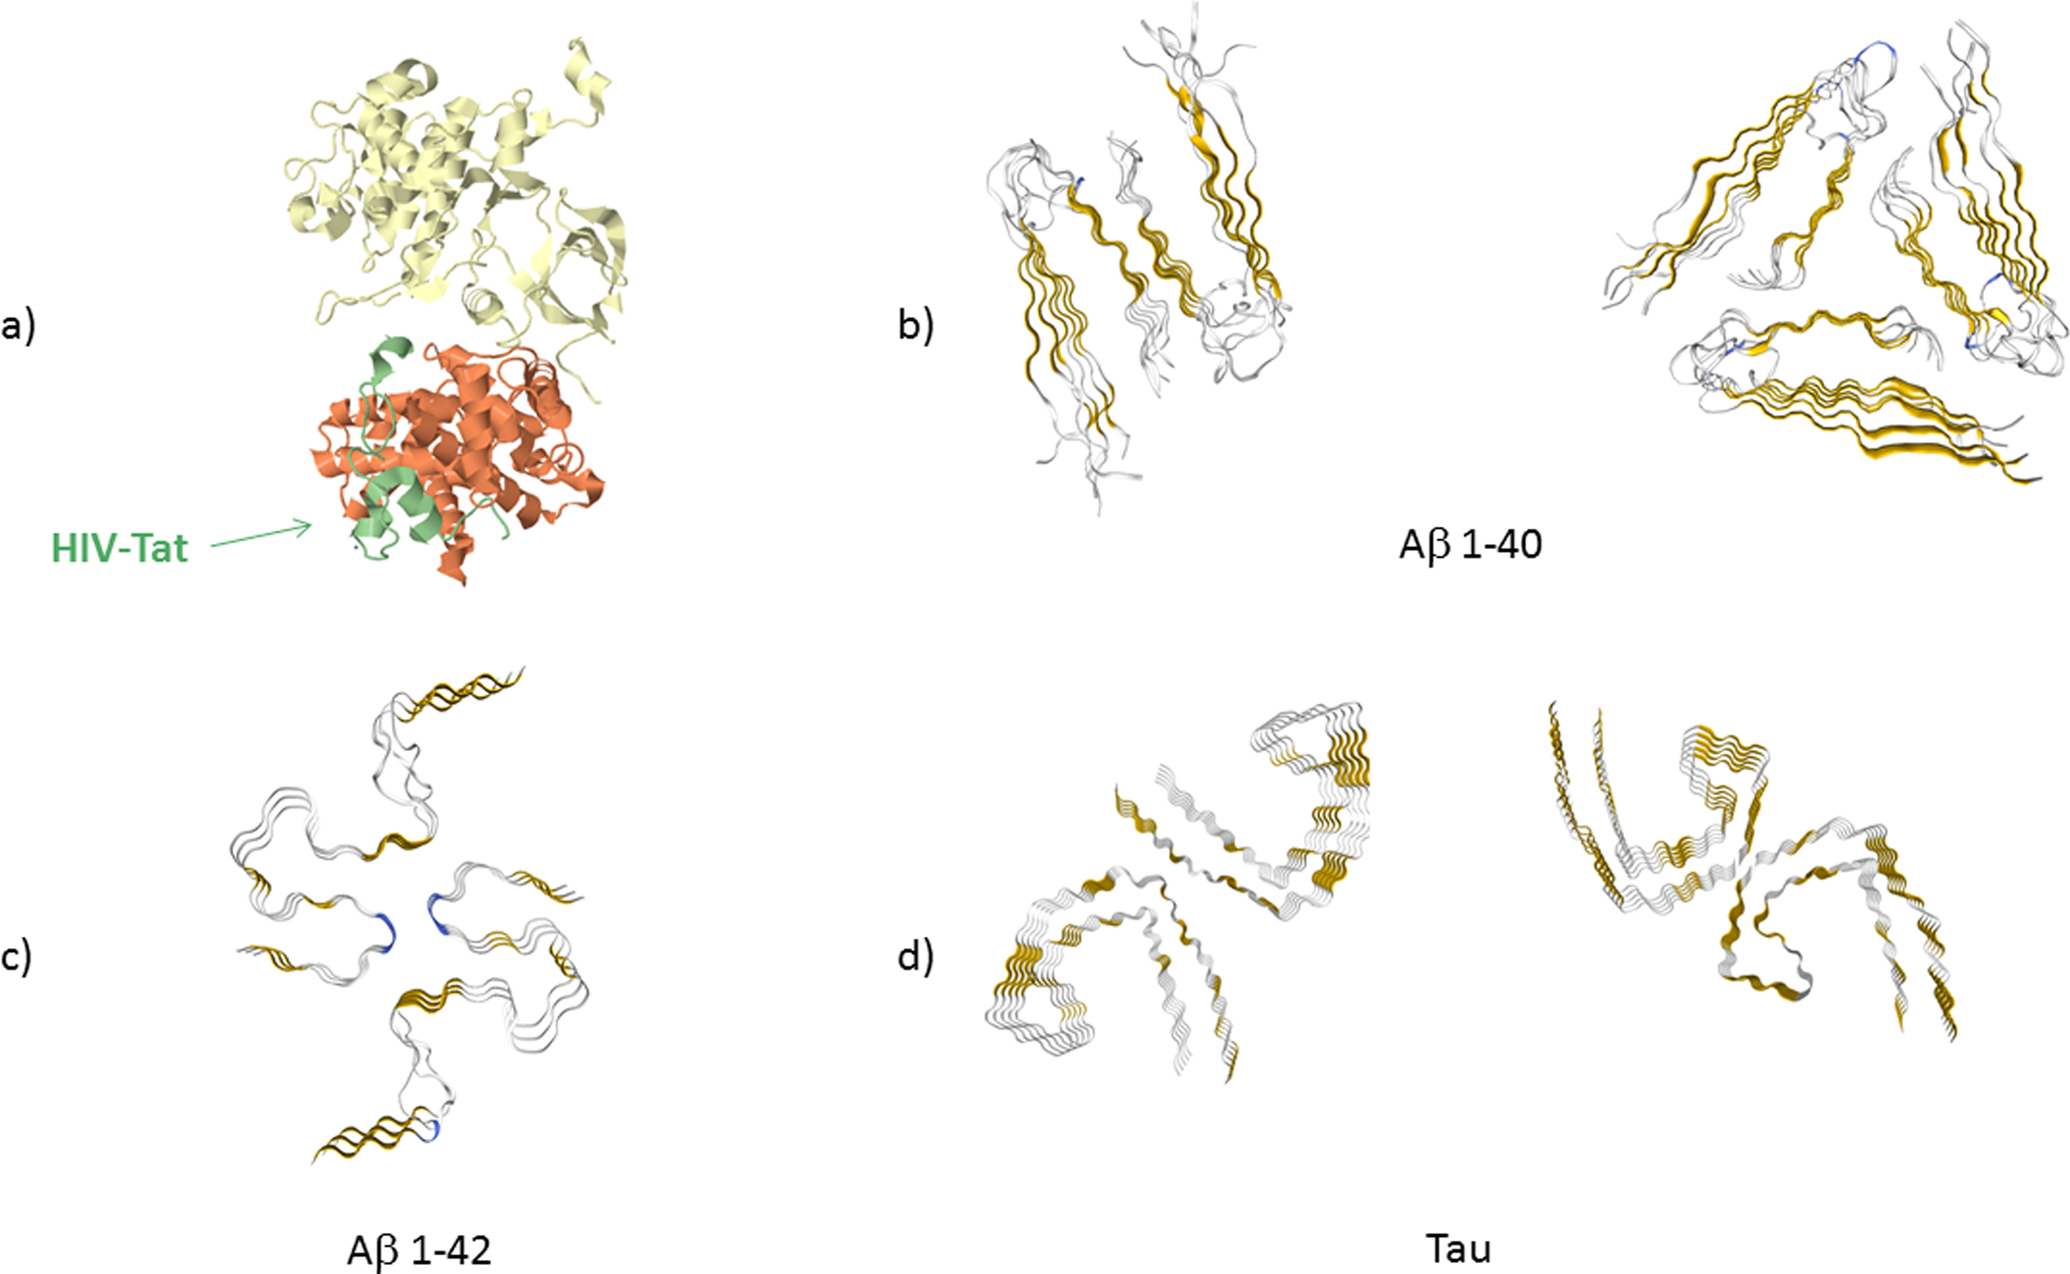
Figure 1. High resolution structures of Tat protein, Aβ 1–40 and 1–42 fibrils and Tau fibrils in cross-section.

(a) Tat (colored in green) in bound state to the protein transcription elongation factor PTEFb (consisting of cell division protein kinase 9 (yellow) and cyclin T1 (orange)) (PDB: 3MI9) obtained by crystalography (Tahirov et al. 2010). Amino acids (aa) 5–50 of Tat are shown. The remaining structure of Tat could not be resolved. (b) Cross-section of Aβ 1–40 fibrils formed in agitated (PDB: 2LMO) and quiescent conditions (PDB: 2LMQ) obtained by nuclear magnetic resonance (Paravastu et al. 2008). Aa 9–40 are shown. (c) Cross-section of Aβ 1–42 fibrils as obtained by solid state, nuclear magnetic resonance, spectroscopy and electron microscopy (PDB: 2NAO) (Walti et al. 2016). Aa 1–42 are shown. (d) Cross-section of Tau protein fibrils for the straight fibrils (PDB: 5O3B) and helical fibrils (PDB: 5O3O), as obtained by cryo electron microscopy (Fitzpatrick et al. 2017). Aa 306–378 are shown (Fitzpatrick et al. 2017). In all cross-section figures of the fibrils, gold color indicates β−sheet structure and blue color indicates β-turn.
