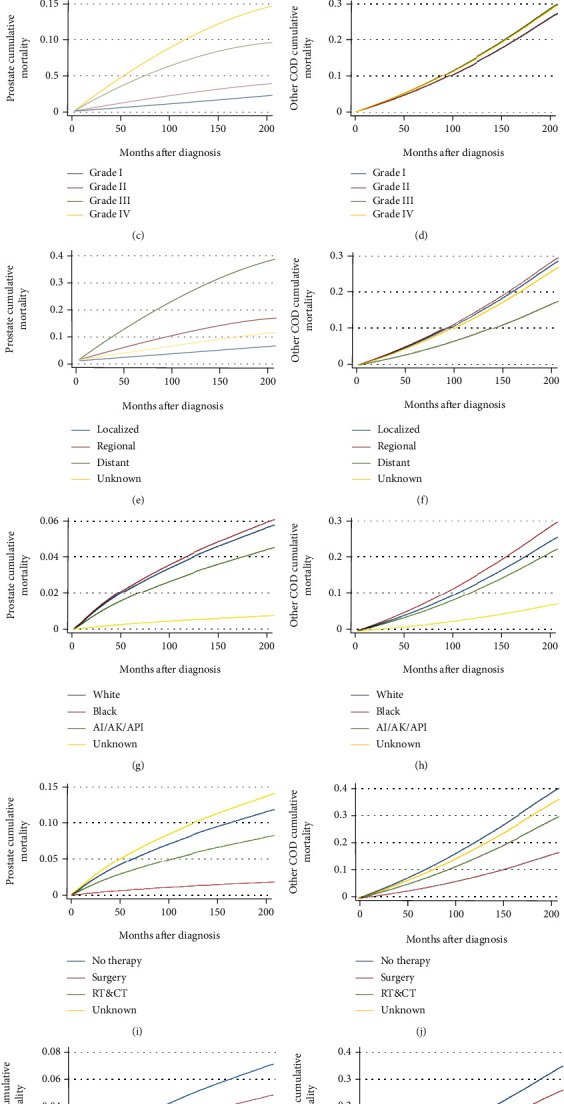
Figure 3.

Multivariable adjusted cumulative incidence function curve of patients with prostate cancer (PCa). Probability of PCa-specific mortality (PCSM) and other causes of death (CODs) by (a and b) age; (c and d) tumor grade; (e and f) stage; (g and h) race; (i and j) therapy; and (k and l) year of diagnosis.
