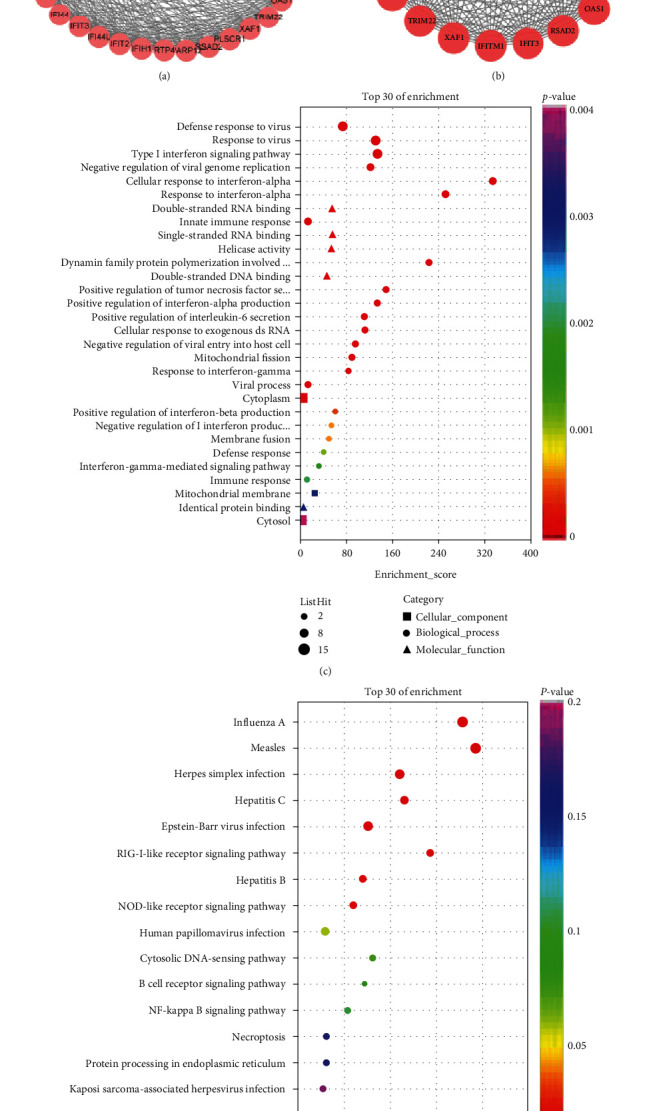
Figure 2.

Protein–protein interaction (PPI) network and identification of hub genes. (a) Protein–protein interaction (PPI) network of 48 common genes in GSE32591 and GSE112943. Nodes in pink represent coupregulated genes while nodes in blue represent codownregulation of genes. The analyzed network holds 43 nodes and 296 edges. (b) Protein–protein interaction (PPI) network of 23 hub genes identified by MCODE in Cytoscape. The analyzed network holds 23 nodes and 240 edges. (c) Top 30 GO functional enrichment of the 23 hub genes. (c) 16 KEGG signaling pathway enrichment of the 23 hub genes.
