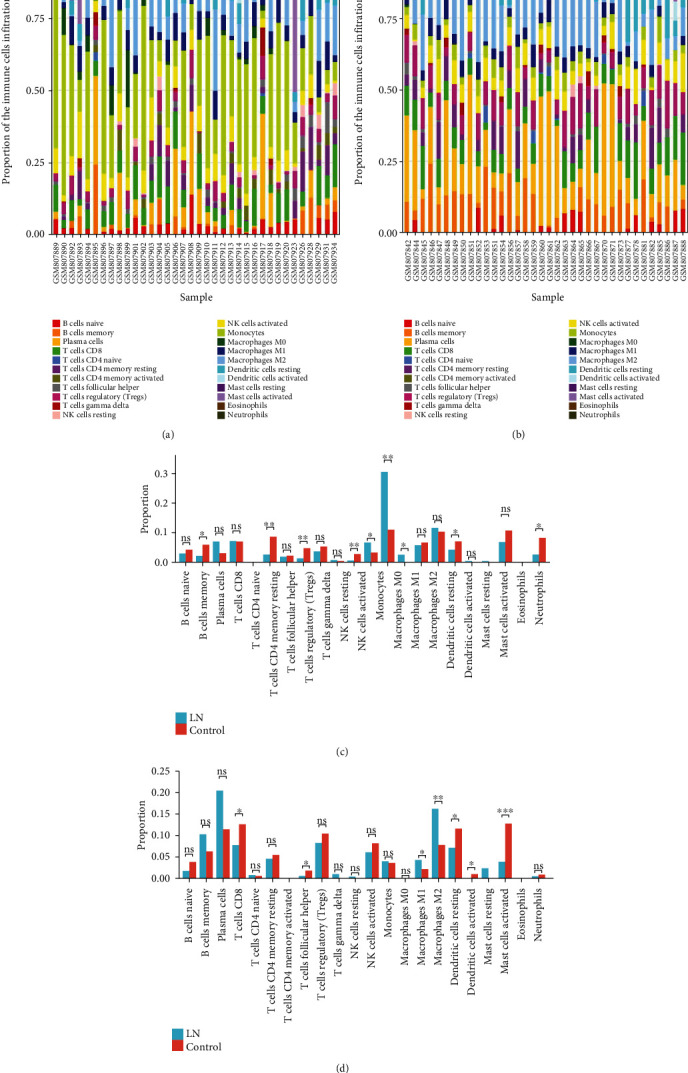
Figure 4.

The landscape of immune infiltration in LN. (a) Bar charts of 22 immune cell proportions in LN and normal glomeruli tissues. (b) Bar charts of 22 immune cell proportions in LN and normal tubulointerstitium tissues. (c) Differential expression of different types of immune cells between LN and normal glomeruli tissues. (d) Differential expression of different types of immune cells between LN and normal tubulointerstitium tissues.
