. 2020 Aug 24;10(52):31215–31232. doi: 10.1039/d0ra04683c

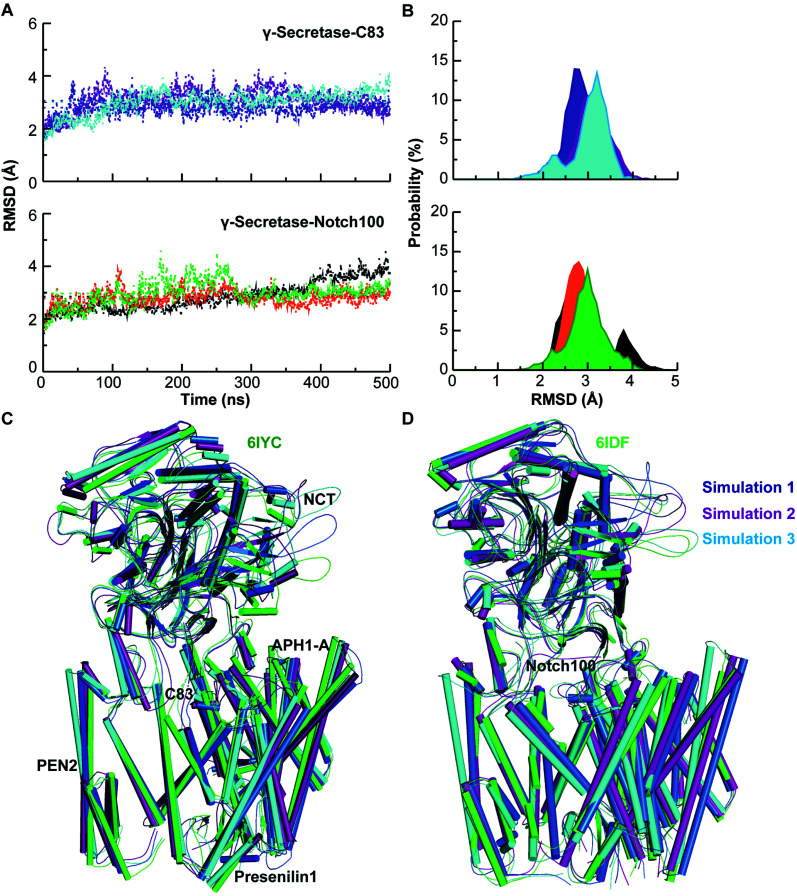
Fig. 2. Dynamical stability and comparison of experimental and simulated structures. (A) Backbone Cα-RMSD of triplicate γ-secretase–C83 and Notch100 simulations relative to the initial structure. Blue, purple and cyan lines represent simulation 1, 2, and 3 for γ-secretase–C83. Black, orange, and green lines represent simulation 1, 2, and 3 for γ-secretase–Notch100. (B) RMSD of γ-secretase–C83 and γ-secretase–Notch100. (C) Experimental γ-secretase–C83 (6IYC, green) compared to structures for simulation 1 (blue), 2 (purple), and 3 (cyan). (D) Experimental γ-secretase–Notch100 (6IDF, green) compared to simulation 1 (blue), 2 (purple), and 3 (cyan).

Fig. 2