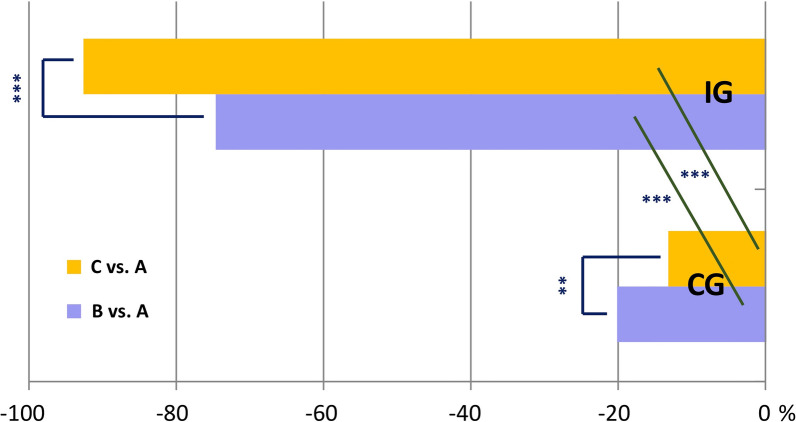
Fig. 4.
Percent decrease of symptomatic hypoglycemic events between/within groups in the three study periods. It was significantly higher in the IG than in the CG (p < 0.0001) during the first follow-up period, despite the further decrease experienced by the IG in the following follow-up period. For within-group results, the decrease observed in the IG was already impressive (p < 0.0001) in the first follow-up period (B) after randomization (A) and continued (p < 0.0001) during the second one (C) while the decrease observed in the CG, besides being much smaller than in the IG, followed an opposite trend, being greater in the first follow-up period (B) after randomization (A) (p < 0.01) and dropping dramatically in the second one (C) (p < 0.01 vs. A and p < 0.01 vs. B, yet). A = T-6/T0 (pre-randomization period); B = T0/T + 6 (first six-month follow-up period); C = T + 6/T + 12 (second six-month follow-up period). **p < 0.01; ***p < 0.0001

