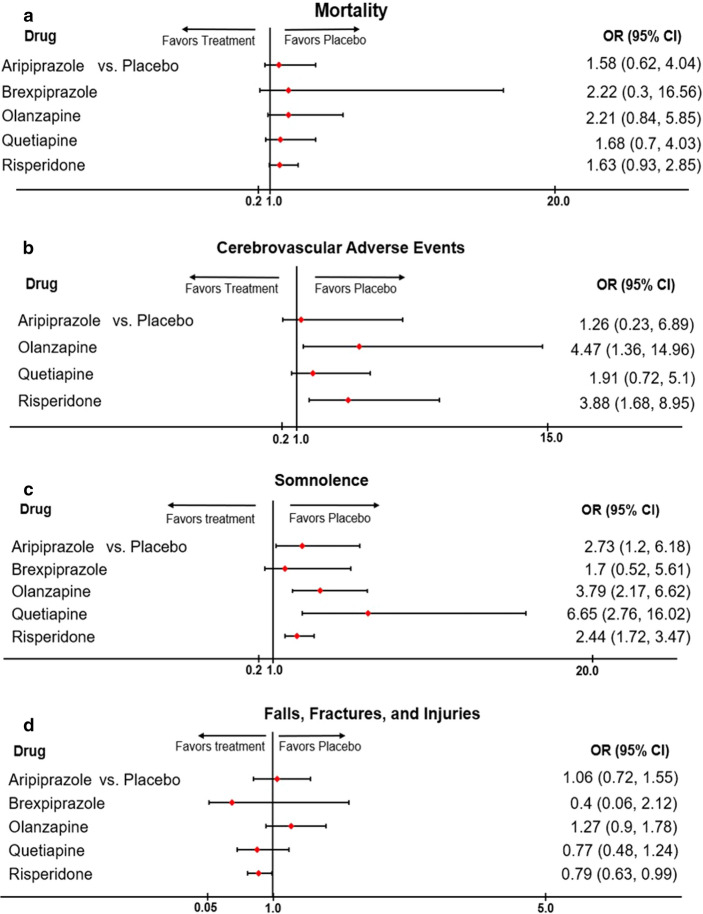
Fig. 3.
Forest plots for primary safety outcomes of a typical antipsychotics compared with placebo. a Forest plot for mortality, representing pooled odds ratio comparing each treatment option with placebo. The diamonds denote the point estimate for each treatment compared to placebo, while the horizontal line denoted the 95% CI. If the 95% CI does not cross 1 (null value); the results imply statistical significance. b Forest plot for CVAE, representing pooled odds ratio comparing each treatment option with placebo. The diamonds denote the point estimate for each treatment compared to placebo, while the horizontal line denoted the 95% CI. If the 95% CI does not cross 1 (null value); the results imply statistical significance. c Forest plot for somnolence, representing pooled odds ratio comparing each treatment option with placebo. The diamonds denote the point estimate for each treatment compared to placebo, while the horizontal line denoted the 95% CI. If the 95% CI does not cross 1 (null value); the results imply statistical significance. d Forest plot for falls, fractures, and injuries, representing pooled odds ratio comparing each treatment option with placebo. The diamonds denote the point estimate for each treatment compared to placebo, while the horizontal line denoted the 95% CI. If the 95% CI does not cross 1 (null value); the results imply statistical significance

