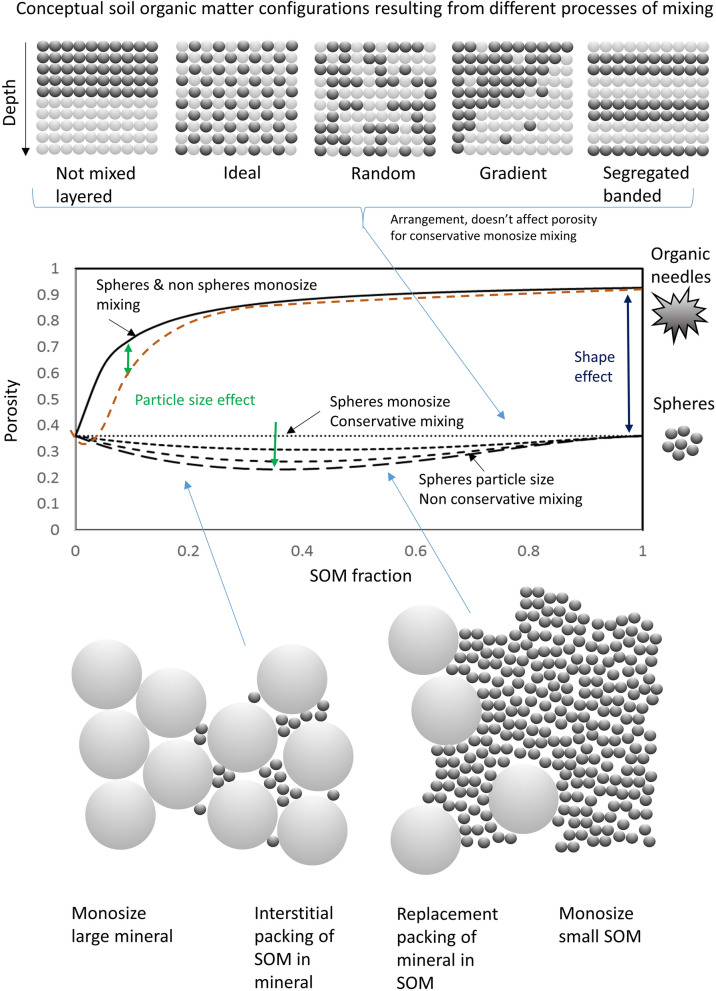
Figure 2.
A conceptual diagram illustrating the expected response of porosity to different forms of mixing of mineral and organic matter accounting for the effects of particle shape and size distribution. The solid black line represents Eq. S18. Particle size distribution for mono-size spheres, then increasingly small spheres packed in large are shown by the dashed lines (size ratios = 0, 2.5. 5, 10), using the equations in Ref.51. The particles on the right side of the graph indicate the change from spherical particles to very non-spherical fibrous particles, the shape effect. The dashed orange line indicates our anticipated effect of particle size in combination with shape. Figure created by first author using Microsoft PowerPoint Version 16.0.4266.1001. https://www.microsoft.com/en-us/microsoft-365/powerpoint.

