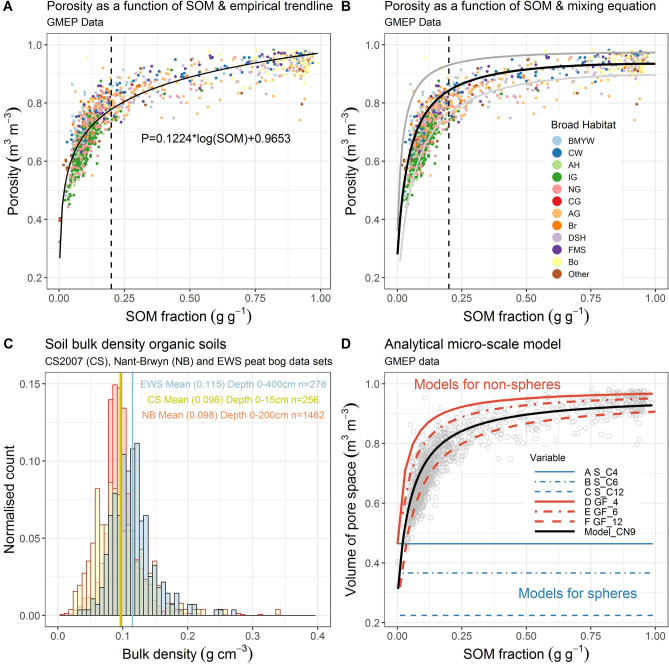
Figure 3.
(A) Soil porosity as a function of soil organic matter (SOM) content from the GMEP data set29 n = 1385. An empirical black trendline is fitted to the data (r2 = 0.81 (actual vs predicted); RMSE = 0.05). The dashed line marks the transition from mineral soils (SOM < 0.2) to organic soils (SOM > 0.2). Markers are colour coded by Broad Habitat: broad-leaved woodland (BMYW) coniferous woodland (CW), arable and horticultural (AH), improved (IG), neutral (NG), calcareous (CG) and acid (AG) grassland, bracken (Br), dwarf shrub heath (DSH), fen marsh swamp (FMS) and bog (Bo). (B) The GMEP data set with the black line modelled using Eq. (1) assuming, intrinsic particle densities ρsOM = 1.4 g cm−3 and ρsM = 2.7 g cm−3 and values for the ‘pure’ SOM BD (ρOM = 0.09 g cm−3) and mineral BD (ρM = 1.94 g cm−3). The thick grey line above and the thin grey line below the black line represent approximate bounds based on porosities for mineral granular media13,14 and the standard deviation for the organic soil (SOM > 0.9). (C) Histograms of BD of organic soils from 3 data sets (EWS, UKCEH Countryside Survey and NB Migneint) described in the “Materials and methods”, “Organic soil bulk density data” section, n = 1462. (D) Soil porosity as a function of SOM for the GMEP data set, grey markers. The 3 blue lines are modelled with Eq. (7) assuming spheres with coordination numbers of 4, 6 and 12. The black line is modelled based on Eq. (7) assuming, intrinsic particle densities ρsOM = 1.4 g cm−3 and ρsM = 2.7 g cm−3 and values for = 117; zOM = 9 determined by minimizing the sum of squares error; µ is discounted. The red lines represent the same model parameters with the coordination number altered to 4, 6 and 12.

