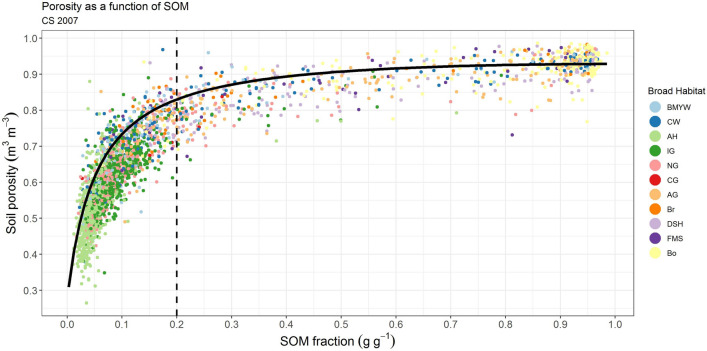
Figure 4.
Soil porosity as a function of soil organic matter (SOM) content from the independent UKCEH Countryside Survey 2007 data set36 n = 2570. The dashed line marks the transition from mineral soils (SOM < 0.2) to organic soils (SOM > 0.2). Markers are color coded by Broad Habitat, broad-leaved woodland (BMYW) coniferous woodland (CW), arable and horticultural (AH), improved (IG), neutral (NG), calcareous (CG) and acid (AG) grassland, bracken (Br), dwarf shrub heath (DSH), fen marsh swamp (FMS) and bog (Bo). The black line is the model (Eq. (7)) with CN = 9 and assuming intrinsic particle densities ρsOM = 1.4 g cm−3 and ρsM = 2.7 g cm−3 and values for = 117; zOM = 9 as used previously on the GMEP data; µ is discounted.

