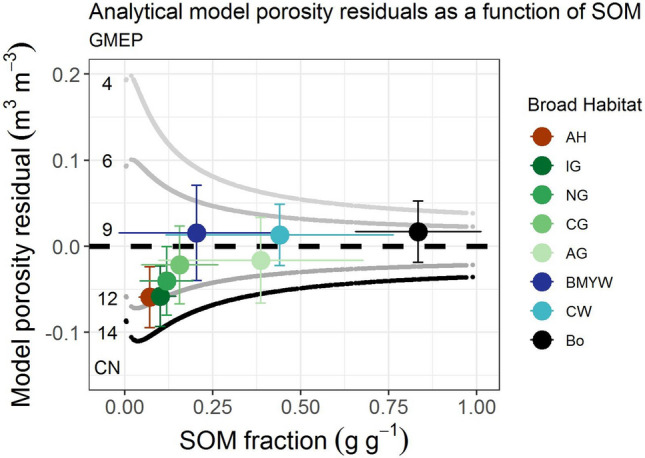
Figure 5.

Sensitivity plot for the porosity residuals for the main broad habitats from the model (Eq. (7), black line plotted in Fig. 3D, CN = coordination number) assuming, intrinsic particle densities ρsOM = 1.4 g cm−3 and ρsM = 2.7 g cm−3 and values for the ‘pure’ SOM BD (ρOM = 0.09 g cm−3) and mineral BD (ρM = 1.94 g cm−3) vs SOM. The upper and lower curved lines are the approximate bounds. The solid circle markers represent the mean response by habitat type (Fig. 4 caption) with standard deviation error bars. The highly managed arable (red) and improved grassland (dark green) show the largest deviation from the model.
