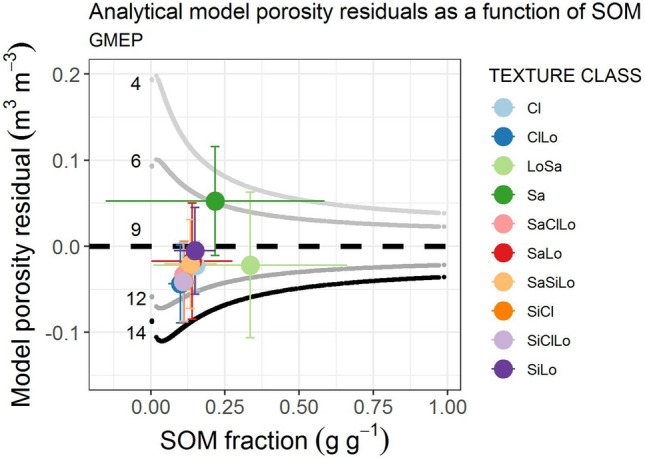
Figure 6.

Residuals plotted as a function of SOM for the respective soil texture groups. Markers are color coded by texture class: clay (Cl), clay loam (ClLo), loamy sand (LoSa), sand (Sa), sandy clay loam (SaClLo), sandy loam (SaLo), sandy silty loam (SaSiLo), silty clay (SiCl), silty clay loam (SiClLo), silty loam (SiLo). Median CN values for each texture class shown in Supplementary Table S1. The residuals show a clear particle size effect in the expected direction. The coarse sandy soils having the lowest coordination number and the fine grained clay soils with a broad particle size distribution having the highest CN. This indicates that CN contains both the shape effect and the secondary particle size effect.
