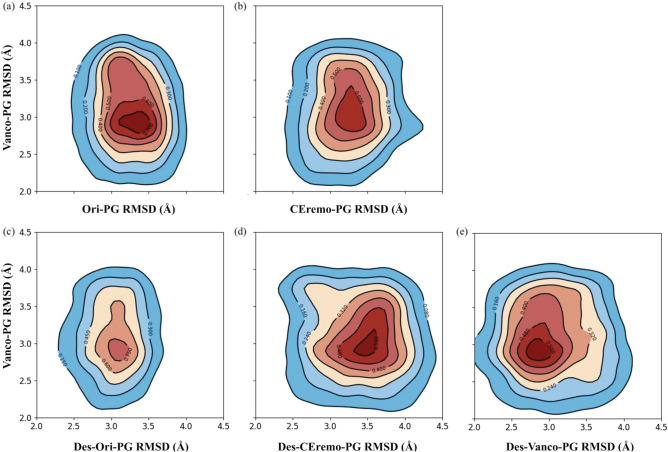
Figure 5.
Comparative 2D rmsd (Å) contour plots of the Ori–PG complex relative to the other complexes. Comparative 2D rmsd contour plots of (a) Ori–PG vs. Ceremo–PG, (b) Ori–PG vs. Vanco–PG, (c) Ori–PG vs. Des-Ori–PG, (d) Ori–PG vs. Des-CEremo–PG, and (e) Ori–PG vs. Des-Vanco–PG complexes. The contour lines are the densities of trajectories located within an area. The region of the highest density of trajectories is denoted by the red color, while the blue colors represent regions of lower densities of trajectories.

