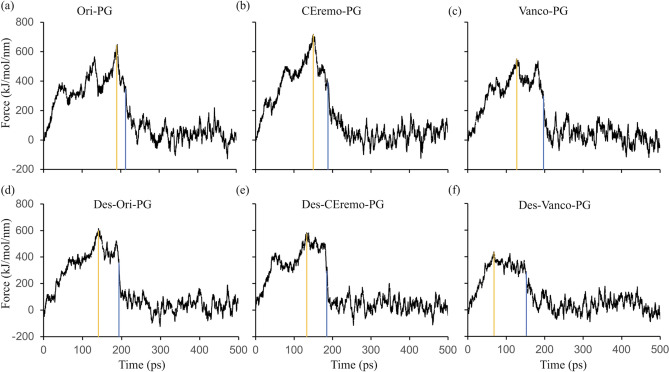
Figure 6.
Plots of force vs time of the dissociation of the (desleucyl)glycopeptide and PG during center-of-mass (COM) pulling simulation. Plots of force vs time for (a) Ori–PG, (b) CEremo–PG, (c) Vanco–PG, (d) Des-Ori–PG, (e) Des-CEremo–PG, and (f) Des-Vanco–PG complexes. The yellow line in each figure corresponds to the point of maximum force and the blue line represents a major dissociation point between the (desleucyl)glycopeptide and PG.

