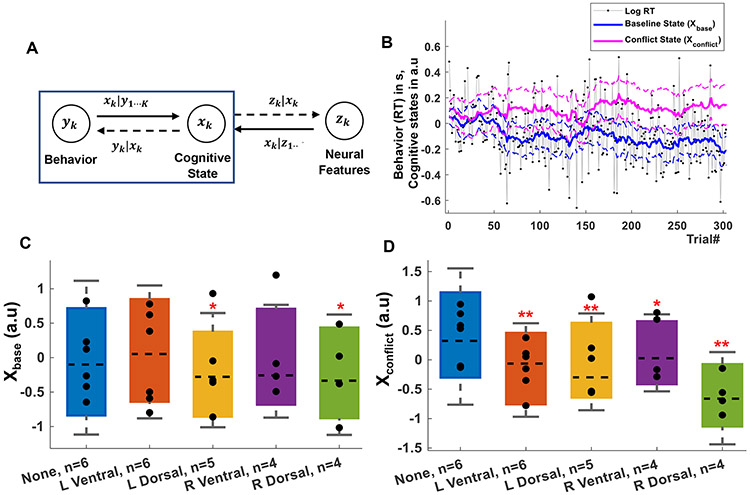
Fig. 3 ∣. Effect of open-loop capsule stimulation on cognitive control:
A) Schematic of the modeling framework, where behavior and neurophysiology are linked through a low-dimensional latent state space. Here, we focus on inferring latent states from behavior (blue box). B) Example of a participant’s raw behavior (RT) and its decomposition into xbase and xconflict. C) Effect of open-loop, randomly interleaved stimulation on xbase (expected RT). Only dorsal stimulation significantly improved this task component (p=0.026). D) Effect of the same stimulation on xconflict (expected RT to high conflict trials). Stimulation in all internal capsule sites altered this aspect of cognitive control (R Ventral: p=0,02, rest: p<0.001). Number of subjects (n) for each stimulation type is specified on the X-axis. In C, D, p-values (*p < 0.05; **p < 0.001) are reported after correcting for multiple comparisons using a false discovery rate. Statistical inference is through non-parametric permutations due to the highly autocorrelated state variables (see Methods). Markers represent individual participants, bars show the median (dashed line) and the bar maxima/minima correspond to 75th and 25th percentile respectively, error bars show standard error of the mean.

