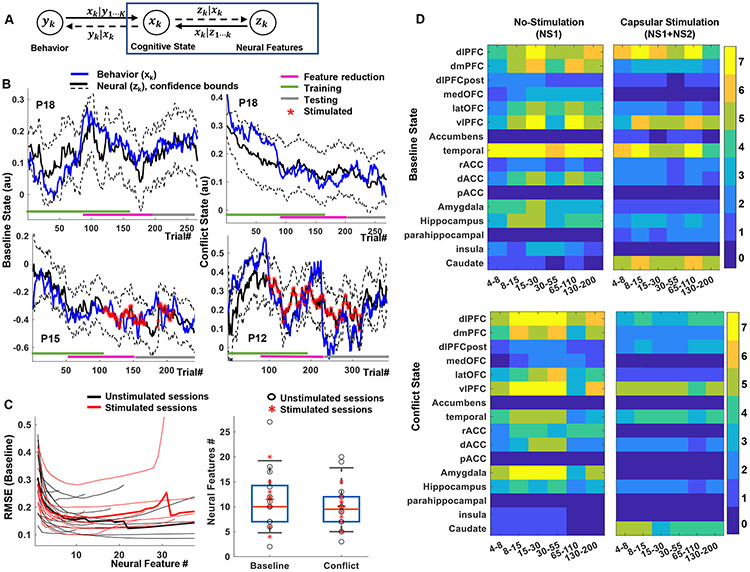
Fig. 5 ∣. Neural decoding of cognitive states.
A) Schematic of the encoding-decoding framework, which uses the same state variables as Fig 3 (Equation 2). Here, we identify linear dependencies between neural features (LFP power) and the latent cognitive states (blue box). B) Examples of baseline (left) and conflict (right) states as estimated from behavior and from neural decoding in subjects P18, P15 and P12. Colored bars at the bottom of the plot indicate the data segments used for training, feature pruning (validation), and testing. There is strong agreement throughout the task run, including on data not used to train the decoding model. Decoding quality is similar during unstimulated (top) and stimulated (bottom) experiments. C) Optimum neural feature set determined using a feature dropping analysis (left). Thin lines represent individual participants (n=21), thick lines the mean. The solid circles indicate the number of features that minimizes root mean squared error (RMSE) for xbase , for each participant, on a held-out validation set. This number of features did not differ between xbase and xconflict, or between stimulated and unstimulated blocks (right). Markers represent individual participants, bars show the median (dashed line) and the bar maxima/minima correspond to 75th and 25th percentile respectively, error bars show standard error of the mean. D) Number of participants encoding xbase (top) and xconflict (bottom) in different brain regions and frequency bands during non-stimulated (left, NS1) and intermittent capsular stimulation (right, NS1+NS2) blocks. Capsular stimulation shifts encoding from cortical regions to subcortical, particularly caudate.

