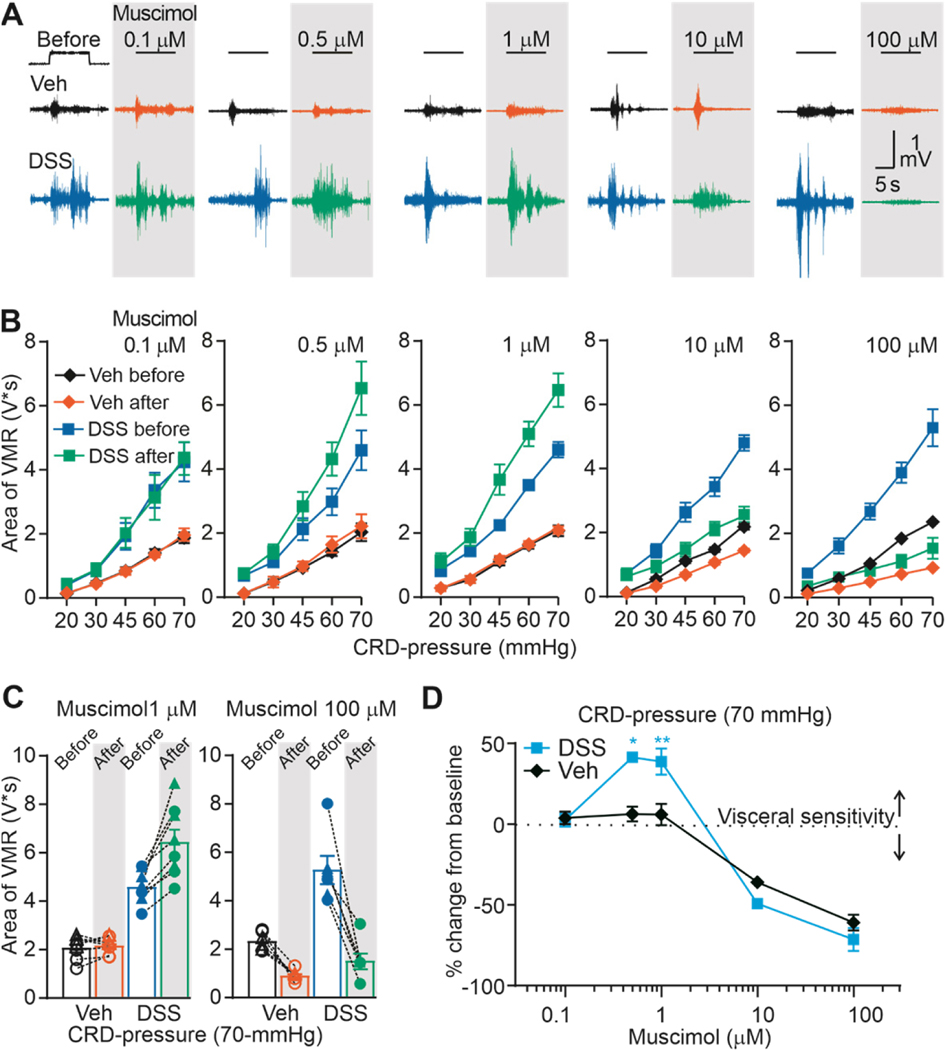
Figure 3. Direct comparation of the effect of muscimol on colon sensitivity (VMR) from vehicle-treated and DSS-treated mice.
A) Typical original recordings of VMR from vehicle-treated (Vehicle) and DSS-treated (DSS) mice in response to CRD-pressure of 70 mmHg before and after admistration of muscimol (0.1, 0.5, 1, 10,100 μM). Time of CRD-pressure 10 s (indicated by black line on top on the recordings). B) VMR data are shown as stimulus-response functions before and after muscimol (0.1, 0.5, 1, 10,100 μM). C) VMR data for individual mice are plotted before and after muscimol 1 and 100 μM. D) Pooled concentration-response data as percent from baseline. *P <0.5, **P < 0.01, n= 7 per group; three-way ANOVA.

