. 2020 Sep 11;10(56):33642–33650. doi: 10.1039/d0ra06718k

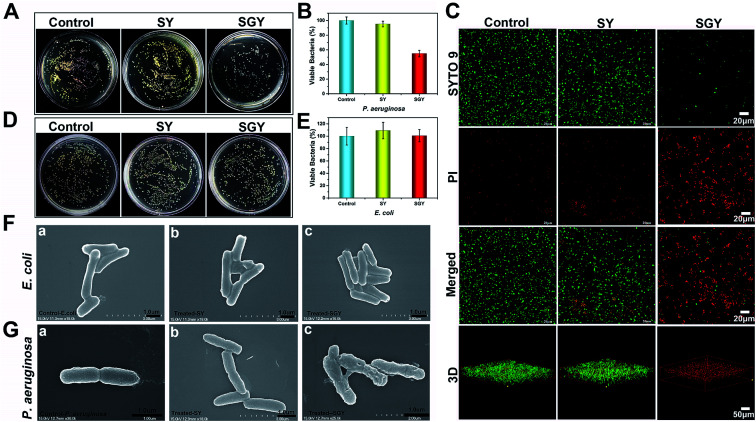
Fig. 3. (A) Optical images of bacterial colonies formed on agar plated at 37 °C for 24 h, after P. aeruginosa (1 × 10⁵ CFU mL−1) was treated by 1 wt% of SGY and 1 wt% of SY hydrogels, respectively. (B) The survival rates of P. aeruginosa shown in Fig. 3A. (C) Fluorescence microscopy images of P. aeruginosa (1 × 10⁵ CFU mL−1) in the control group or incubated on the surface of the SGY (1 wt%) and SY (1 wt%) hydrogels for 24 h, followed by live/dead staining. (D) Optical images of bacteria colonies formed on agar plated at 37 °C for 24 h, after E. coli (1 × 10⁵ CFU mL−1) was treated by 1 wt% of SGY and 1 wt% of SY hydrogels. (E) The survival rates of E. coli shown in Fig. 3D. SEM images of (F) E. coli and (G) P. aeruginosa in the control group or treated by the SY and SGY hydrogels for 24 h, respectively.

Fig. 3