. 2020 Sep 30;10(59):35856–35872. doi: 10.1039/d0ra06849g

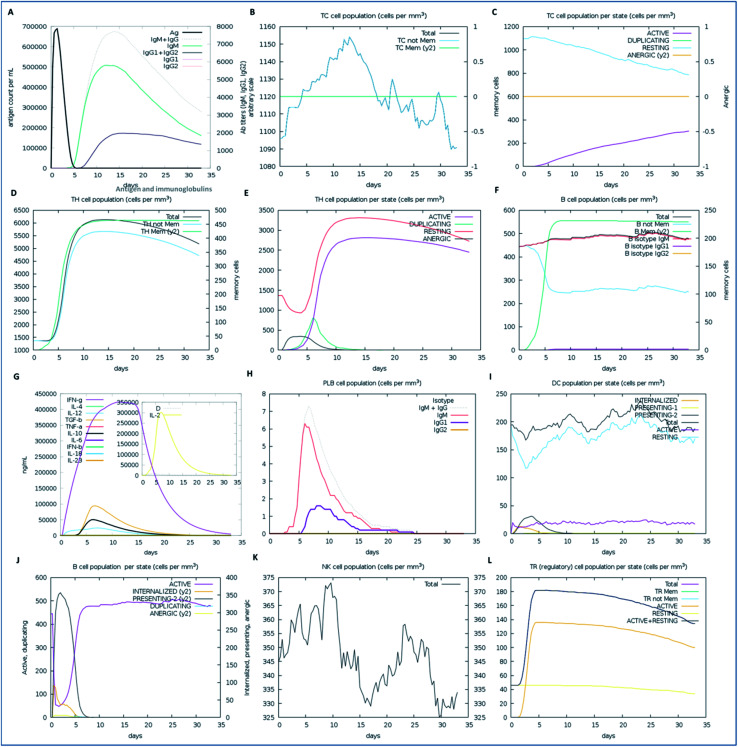
Fig. 7. The immune response of the designed vaccine. (A) Elevation of immunoglobulins at different concentrations of antigen, (B) cytotoxic T-cell count, (C) T-cytotoxic cell populations in different states; resting and active, (D) helper T-cell population, (E) helper T-cell count in the resting and active states, (F) B-cell populations (IgM, IgG1, and IgG2) in response to the designed vaccine, (G) elevation of cytokines and interleukin cells, (H) B-cell populations (IgG and IgM) reached up to 7.2 cells per mm3, (I) dendritic cell population in the active and resting states, (J) B-cell populations in different states (active, internalized, and anergic), (K) natural killer cells throughout the 35 days, which reached a level of up to a maximum of 374 cells per mm3, and (L) T-regulatory cell population proliferation in the active and resting states.

Fig. 7