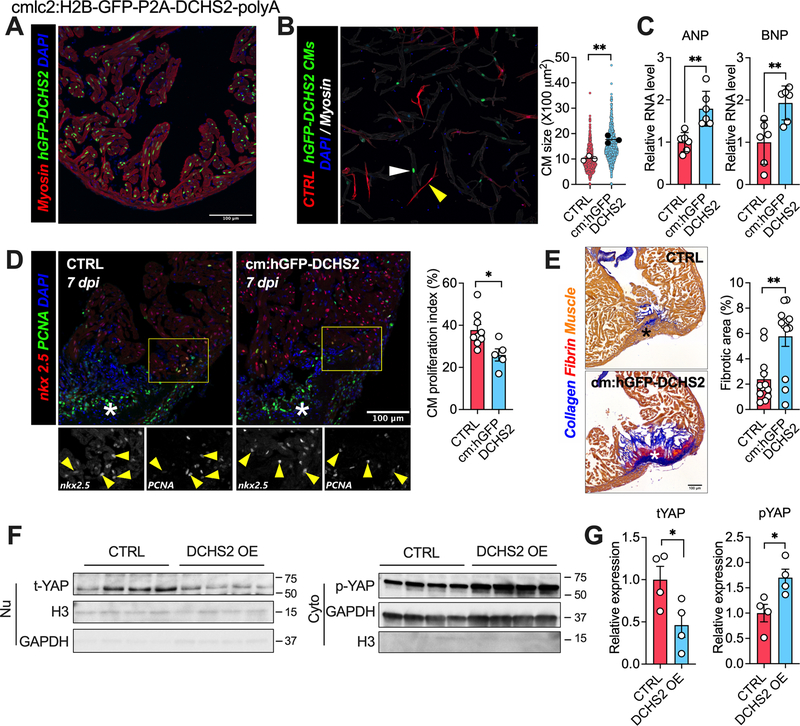
Figure 6. DCHS2 overexpression induces pathological cardiac hypertrophy and reduces regenerative capacity in zebrafish.
A. Representative image from apex region of an adult transgenic zebrafish heart immunostained for tropomyosin (Red), GFP (Green), and nuclei (DPAI, Blue). B. Representative image and quantification of cardiomyocytes size isolated from wild-type control (CTRL, white arrow) or DCHS2 overexpression (hGFP-DCHS2, yellow arrow) zebrafishes. C. QRT-PCR measurement of ANP and BNP in hearts from CTRL and hGFP-DCHS2 zebrafishes. D. Representative images and quantification of nkx2.5 and PCNA double positive cardiomyocytes in hearts at 7 days post injury (dpi) from CTRL and hGFP-DCHS2 zebrafish. E. Representative images and quantification of fibrosis in hearts at 60 days post injury (dpi) from CTRL and hGFP-DCHS2 zebrafish. F and G. Representative images and quantification of nuclear total Yap1 and cytoplasmic p-Yap1 protein expression in hearts from CTRL and hGFP-DCHS2 zebrafish. *p<0.05, **p<0.01 by Student’s t test. Data shown as mean±SEM.

