. 2020 Oct 1;10(60):36337–36348. doi: 10.1039/d0ra08003a

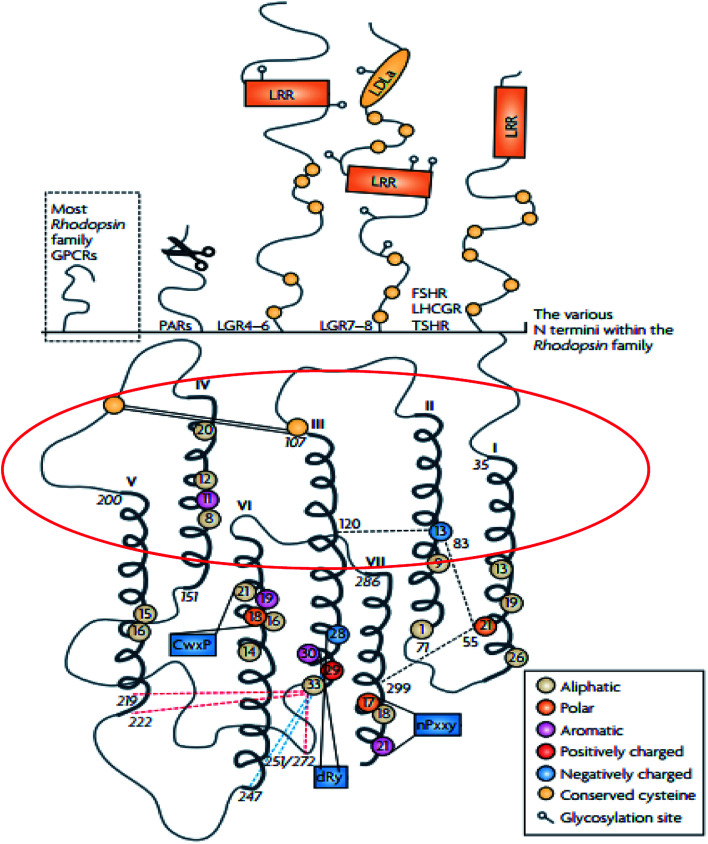
Fig. 2. Schematic diagram showing the structure of family A GPCRs generated using ClustalW.31 Reprinted with permission from Springer Nature: Springer Nature, Nature Reviews Drug Discovery, Structural diversity of G protein-coupled receptors and significance for drug discovery, M. C. Lagerström and H. B. Schiöth, Copyright (2008). The upper section of shows the differences in the secondary structure of the N termini of the family A receptors.31 The scissor image indicates the cleavage site of the protease activated receptors whilst in the lower part of the image, the schematic TMD regions show the consensus of an alignment generated using ClustalW 1.82.31 In addition, the area circled in red describes the elliptical orientation.31 Residues conserved in all eight sequences are displayed as circles in which conserved aromatic residues are shown in purple, polar in orange, aliphatic residues are shown in beige, positively charged in red and negatively charged in blue.31.

Fig. 2