. 2020 Oct 1;10(60):36337–36348. doi: 10.1039/d0ra08003a

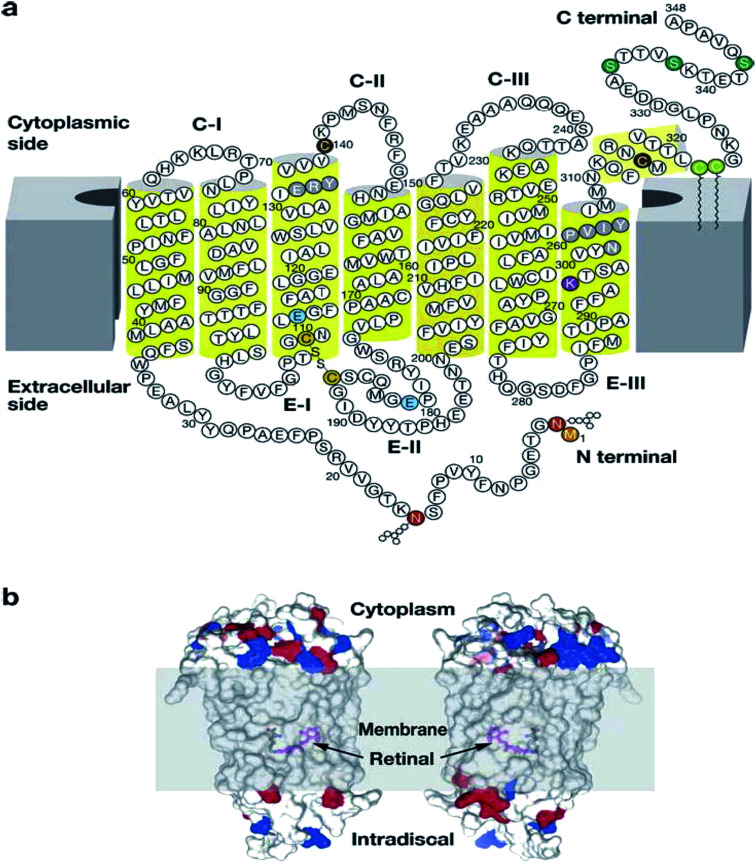
Fig. 3. Illustration showing the modification of rhodopsin and its orientation in membranes.30 Reprinted with permission from Annual Reviews: Annual Reviews, Annual review of biochemistry, G protein–coupled receptor rhodopsin, K. Palczewski, Copyright (2006). (a) Two-dimensional illustration of rhodopsin. The polypeptide of rhodopsin is seen to cross the membrane seven times with C-I, C-II, C-III comparable to the cytoplasmic loops and E-I, E-II, E-III to the extracellular loops. The yellow cylinders represent the transmembrane region (b) depicts the location of the chromophore and the charges on the extracellular and cytoplasmic surface of rhodopsin. Red and blue colours represent negative and positive charged residues respectively, while the location of the chromophore is revealed by deleting fragments of the transmembrane helices.30.

Fig. 3