
FIGURE 5.
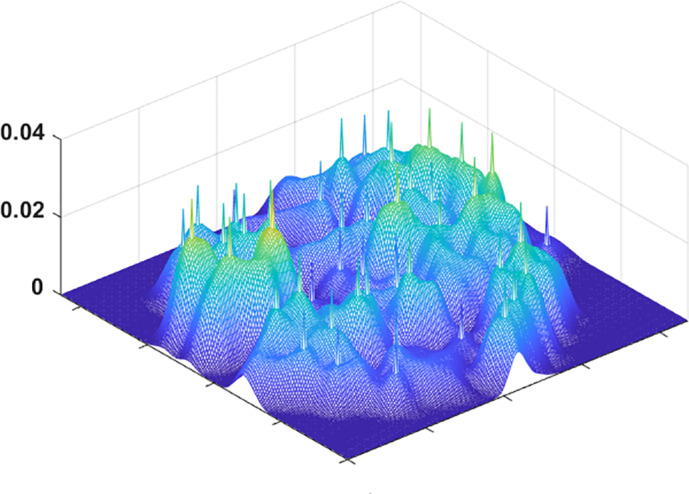
A three‐dimensional view of the tSNE plot after marking the peaks extracted by a 2D peak finder. The peak finder selects at least one peak from each high‐density region. Later, we use peak's tSNE coordinates to determine the real motifs it represents