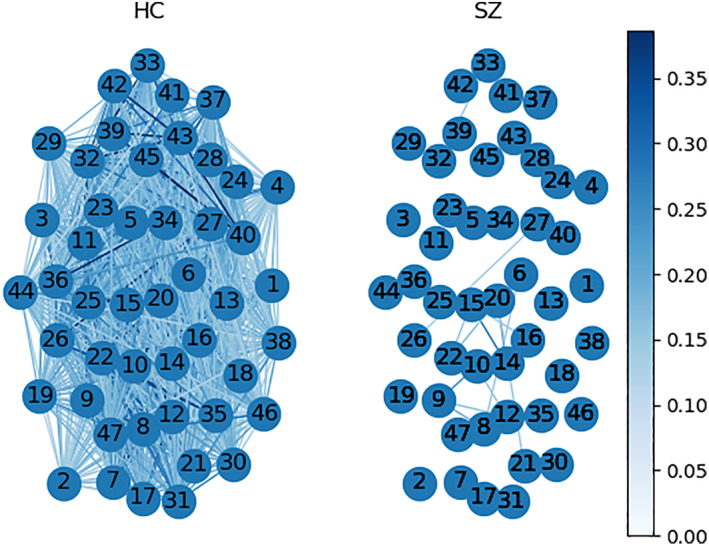
FIGURE 10.

Time decay graphs from both groups. The nodes are functional networks, edges correspond to the connection between them (maximum 1,081 possible), and the weight represents the mean time decay (TD) of a connection within a group dynamic. We compute color scaling from the 95 percentiles of the total values. After thresholding at average group mean (SZ group mean + HC group mean)/2, 1,061 edges survive in the HC group and only 16 edges in the SZ group
