
Fig. 4.
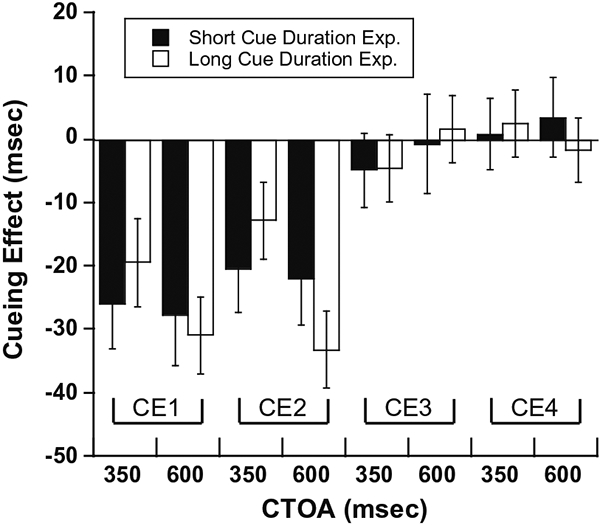
Comparison of cueing effects in the short and long cue duration experiments. The four types of cueing effects (CE1–CE4) are shown separately for short (black bars) and long (clear bars) cue duration experiments. For each experiment and each type of cueing effect, cueing effects are shown for CTOAs of 350 and 600 ms. The error bars represent 95% confidence interval of the median.