. 2020 Oct 29;10(65):39662–39672. doi: 10.1039/d0ra07318k

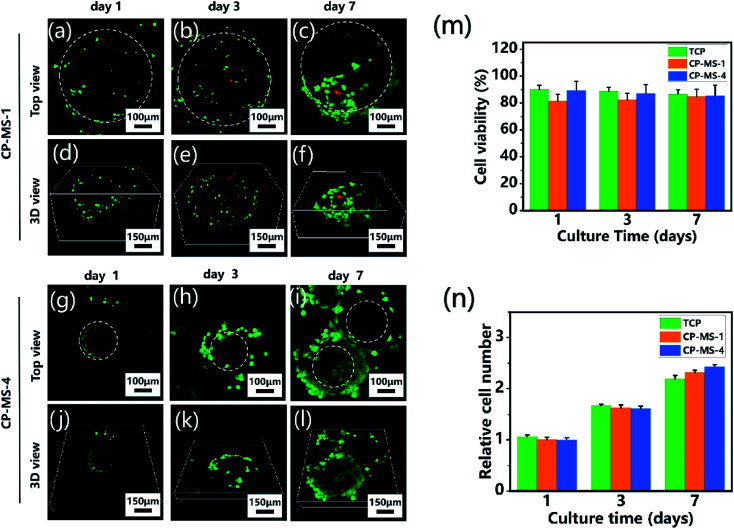
Fig. 5. Cell viability and proliferation of chondrocyte-laden CP-MSs. The top view (a–c) and 3D view (d–f) confocal images of chondrocytes cultured on CP-MS-1 (550 ± 9 μm) after cultivation for 1, 3, and 7 days. The top view (g–i) and 3D view (j–l) confocal images of chondrocytes cultured on CP-MS-4 (220 ± 16 μm) after cultivation for 1, 3, and 7 days. Live cells (green) were stained with calcium AM and dead cells (red) were stained with ethidium homodimer. White dashed lines show approximate borders of microspheres. (m) Quantification of cell viability for TCP, CP-MS-1, and CP-MS-4 groups after 1, 3, and 7 days. (n) Relative cell number of chondrocytes in TCP, CP-MS-1, and CP-MS-4 groups after culturing for 1, 3, and 7 days.

Fig. 5