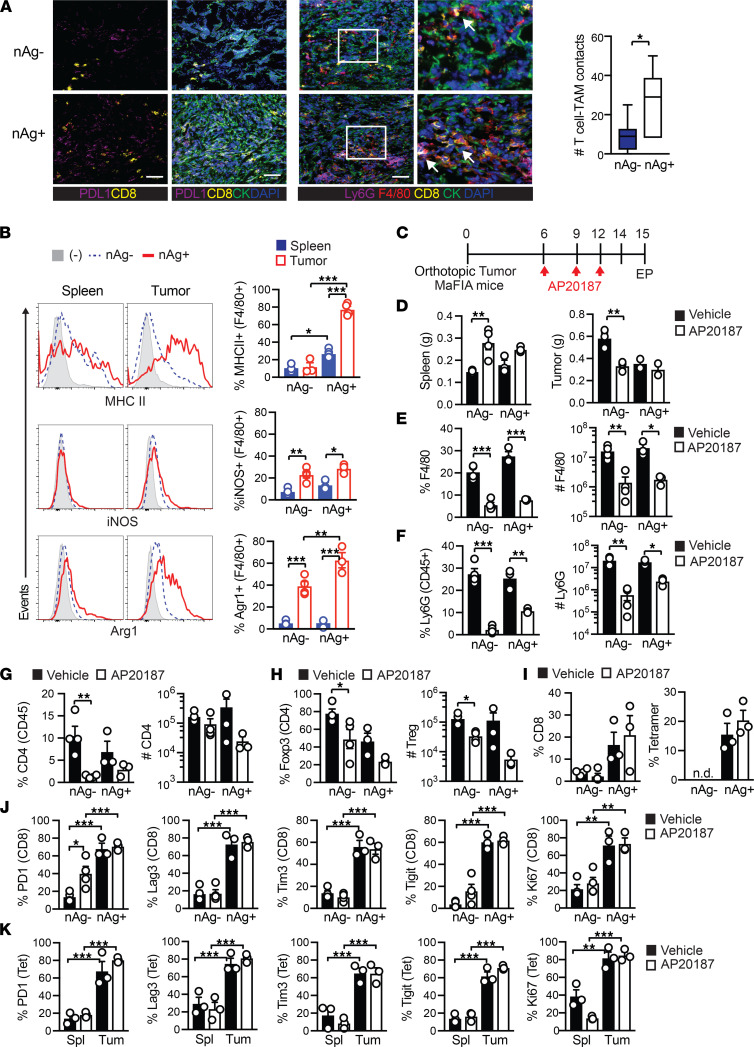
Figure 1. Protumor roles for TAMs and granulocytic myeloid-derived suppressor cells are obviated in neoantigen+ PDA.
(A) Immunofluorescence staining of CB+ (nAg+) or CB– (nAg–) orthotopic tumors on day 21. Arrows show CD8+ T cell contact with a macrophage. Scale bar: 50 μm. Original magnification of insets, 2.25×. The number of CD8+ T cell and TAM (F4/80+) contacts per field of view. The box plots depict the minimum and maximum values (whiskers), the upper and lower quartiles, and the median. The length of the box represents the interquartile range. (B) Proportion of splenic and intratumoral F4/80+ macrophages that express MHC II, iNOS, or Arg1 on day 14 posttumor. (C) Schematic for TAM depletion in MaFIA tumor-bearing mice. (D) Spleen and tumor weights on day 15. (E) Splenic F4/80+ cell proportion (of CD45+ cells) and number (normalized to tissue gram) from control or AP20187-treated MaFIA mice. (F) Intratumoral Ly6G+ frequency gated on CD45+ cells and cell number per gram tumor tissue. (G) Intratumoral CD4+ T cell frequency gated on CD45+ cells and number per gram tumor. (H) Intratumoral Treg frequency (of CD4+ cells) and number per gram tissue. (I) Intratumoral CD8+ T cell frequency gated on CD45+ (left) and CB101-109-specific T cell frequency gated on CD8+ T cells (right). n.d., not detected. (J) PD-1, Lag3, Tim3, Tigit, or Ki67 gated on total intratumoral CD8+ T cells. (K) Expression of PD-1, Lag3, Tim3, Tigit, or Ki67 gated on CB101-109:H-2Db tetramer+ CD8+ T cells isolated from spleen (Spl) or tumor (Tum) from nAg+ tumor-bearing mice on day 15. In graphs, each dot is an independent mouse, data are mean ± SEM, and n = 3–5 mice per group and representative of 2 independent experiments. One-way ANOVA with a Tukey’s posttest (B and G–K) or Student’s t test to compare 2-group data (A) and 2-group data within each similar tumor-bearing cohort (D–F). *P < 0.05, **P < 0.005, and ***P < 0.0005.

