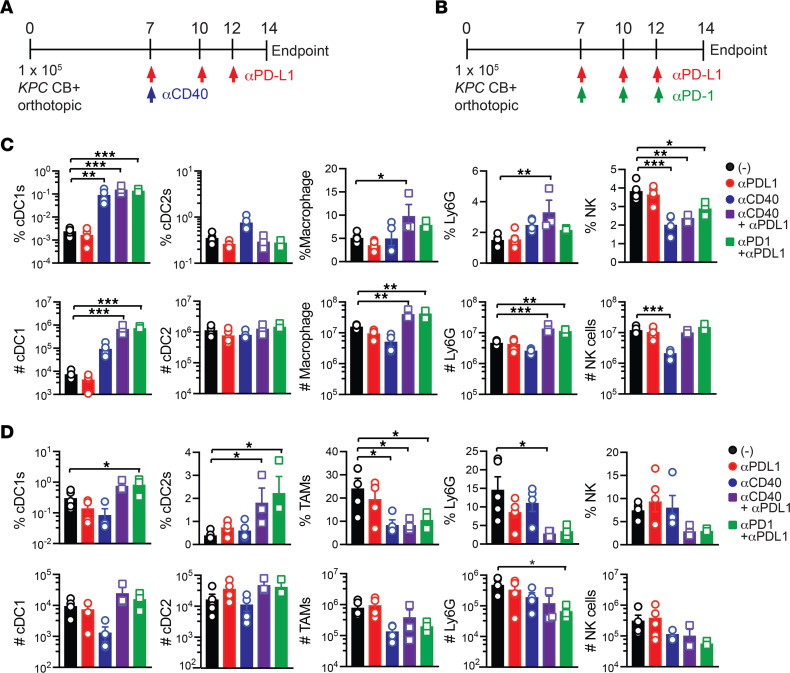
Figure 3. Effective immunotherapy regimens expand splenic cDC1s.
Schematic for testing agonistic αCD40 + αPD-L1 (A) or αPD-L1 + αPD-1 (B) on immune cell composition in nAg+ orthotopic tumors. (C) Frequency (top row, gated on live CD45+ cells) and number (bottom row, normalized to tissue gram) of immune cells in spleen from control or immunotherapy-treated mice. (D) Frequency (top row, gated on live CD45+ cells) and number (bottom row, normalized to tissue gram) of immune cells in tumor from control or immunotherapy-treated mice. Each dot is an independent animal. Data are mean ± SEM and n = 4–6 mice per group and 2 independent experiments. *P < 0.05, **P < 0.005, ***P < 0.0005. One-way ANOVA with a Tukey’s posttest.

