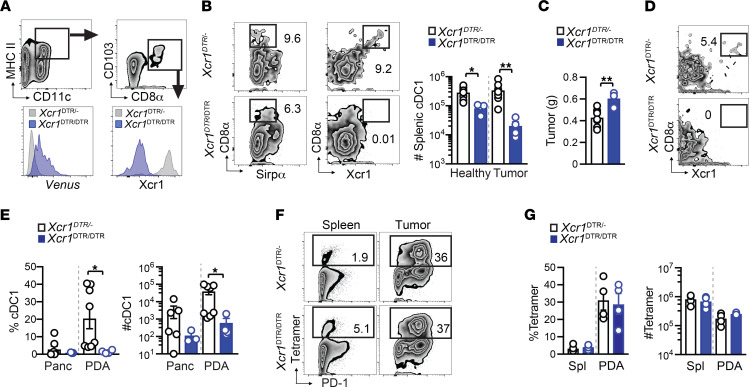
Figure 5. Xcr1 signaling mediates splenic and intratumoral cDC1 accumulation.
(A) Gating strategy and Xcr1 expression by splenic cDC1s isolated from unmanipulated Xcr1DTR/– or Xcr1DTR/DTR mice. Histogram overlays represent the Venus reporter (left) and Xcl1 antibody staining (right). (B) Representative flow cytometric plots of spleen cells gated on CD11c+MHC II+ DCs on day 14 after orthotopic CB+ tumor implantation. Quantification of splenic cDC1 number in normal or day 14 tumor-bearing mice. (C) Orthotopic tumor weight in grams at day 14. Unpaired 2-tailed Student’s t test. (D) Representative plots of intratumoral cDC1s from Xcr1DTR/– or Xcr1DTR/DTR mice at day 14. Gated on CD11c+MHC II+ DCs. (E) Proportion and number of cDC1s isolated from healthy pancreas (Panc) or from orthotopic tumors at day 14. Data are mean ± SEM, Student’s t test. (F) Frequency of splenic and intratumoral CD8+ T cells that bind CB101-109:H-2Db tetramer at day 14. Plots are gated on live, CD45+CD8+ T cells. (G) Frequency (left) and number (right) of CB101-109:H-2Db-specific CD8+ T cells in spleen (Spl) and tumors at day 14 after tumor implantation. Student’s t test. (B–E and G) Each dot is an independent mouse. Data are mean ± SEM and pooled from 2 independent experiments. n = 4–7 mice per group. *P < 0.05, and **P < 0.005.

