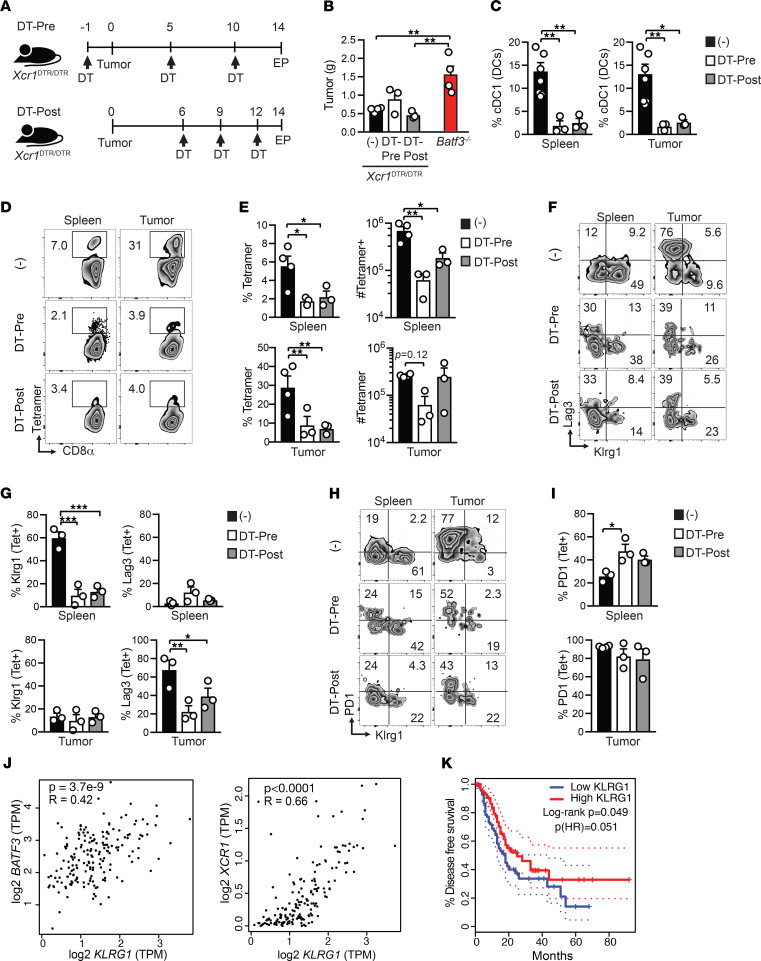
Figure 6. cDC1s promote endogenous splenic Klrg1+ and intratumoral Lag3+ tumor-specific T cells.
(A) Schematic of diphtheria toxin (DT) administration in orthotopic tumor-bearing Xcr1DTR/DTR mice to deplete cDC1s prior to (DT-pre) or following (DT-post) tumor implantation. EP, endpoint. (B) Tumor weights isolated from untreated Xcr1DTR/DTR mice, Xcr1DTR/DTR mice treated with DT either prior to (Pre) or after tumor implantation, and Batf3–/– mice on day 14. One-way ANOVA with a Tukey’s posttest. (C) cDC1 frequency among CD11c+MHC II+ DCs in control or DT-treated Xcr1DTR/DTR mice. One-way ANOVA with a Tukey’s posttest. (D) Representative CB101-109:H-2Db tetramer staining gated on CD8+ T cells from untreated or DT-treated Xcr1DTR/DTR mice. (E) Quantification of D. One-way ANOVA with a Tukey’s posttest. (F) Representative Lag3 and Klrg1 staining by CD8+tetramer+ T cells. (G) Quantification of F. One-way ANOVA with a Tukey’s posttest. (H) Representative PD-1 and Lag3 staining by CD8+tetramer+ T cells. (I) Quantification of H. One-way ANOVA with a Tukey’s posttest. (J) Correlation between KLRG1 and cDC1 genes in 176 human PDAs from The Cancer Genome Atlas (TCGA) data set was determined using GEPIA (http://gepia.cancer-pku.cn/). (K) Patient tumors with high KLRG1 transcripts per million (TPM) have significantly improved disease-free survival. 176 PDAs from the TCGA data set were divided into KLRG1-high (n = 88) or KLRG1-low (n = 88) expressers and survival outcomes determined using GEPIA. Graphed data are mean ± SEM. n = 4 mice per group. Representative of 2 independent experiments. *P < 0.05, **P < 0.005, and ***P < 0.0005.

