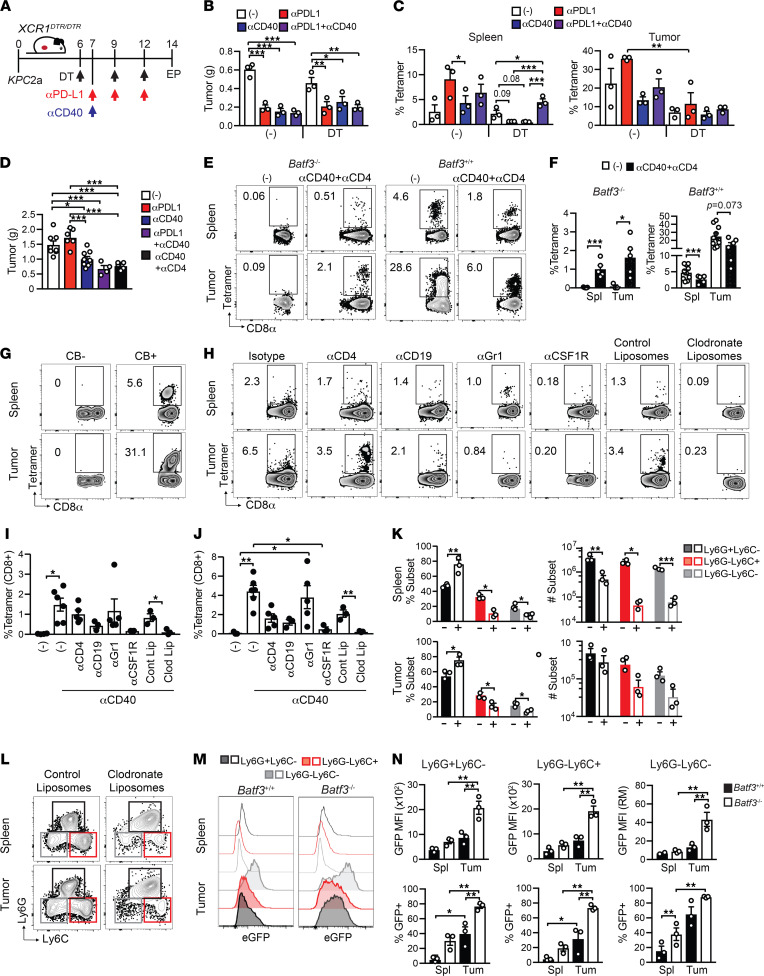
Figure 8. CD40 agonist exhibits partial antitumor activity and primes tumor-specific CD8+ T cells via monocytes/macrophages in Batf3–/– mice.
(A) Experimental schematic. EP, endpoint. (B) Orthotopic tumor weights on day 14. (C) Proportion of splenic (left) and intratumoral (right) CD8+ T cells that bind CB101-109:H-2Db tetramer. There were no significant differences in tumor size between control and cDC1-depleted cohorts. (D) Tumor weights in treated or control Batf3–/– mice on day 14. (E) Representative of tetramer+ T cell frequency gated on CD8 T cells. (F) Quantification of E. (G) Frequency of tetramer+ T cells from orthotopic CB– or CB+ tumors on day 14 posttumor. Representative of n = 10 mice. (H) Frequency of CD8+tetramer+ T cells from Batf3–/– mice treated with CD40 agonist and various cell depletions. CD8+tetramer+ T cell frequency in spleen (I) and tumor (J). (K) Frequency (left) and number (right) of the indicated CD11b+ myeloid subsets in Batf3–/– mice that received control liposomes (-) or clodronate liposomes (+) and were treated with CD40 agonist in spleen (top) and tumor (bottom). (L) Myeloid subsets are gated on live, CD45+CD11b+ cells. (M) Representative histograms of EGFP among myeloid subsets from Batf3+/+ and Batf3–/– mice on day 7 after agonistic αCD40. (N) Graphed data from M in spleen (Spl) and tumor (Tum). All graphed data are mean ± SEM and each dot is an independent animal. Representative of at least 2 independent experiments. *P < 0.05, **P < 0.005, and ***P < 0.0005. One-way ANOVA with a Tukey’s posttest (B, C, D, I, J, and N); Student’s t test (F and K). n = 3–8 mice per group.

