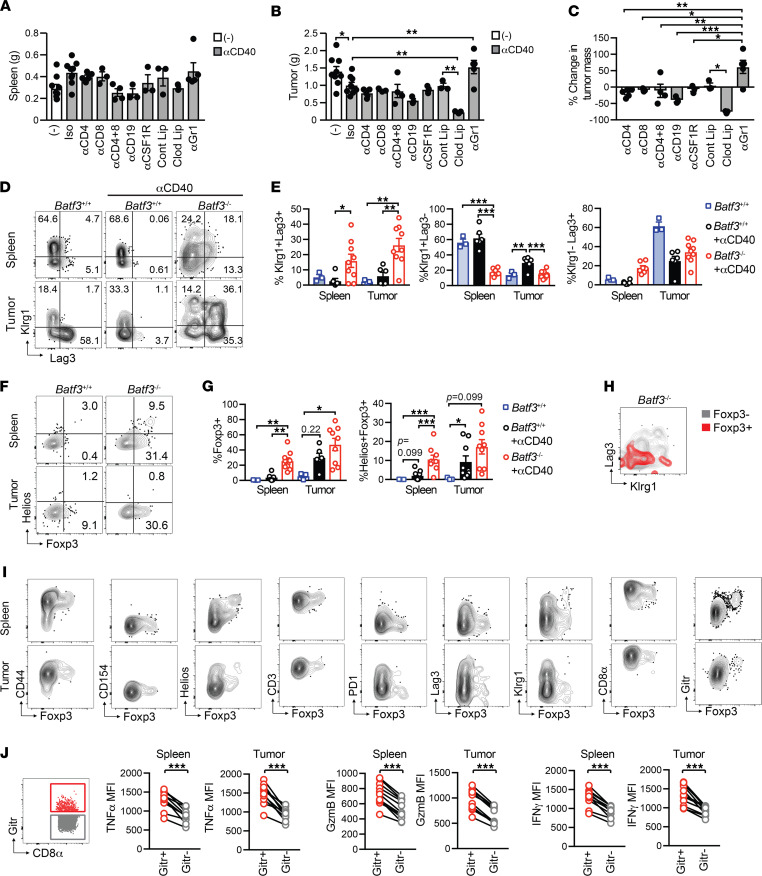
Figure 9. αCD40-induced monocyte/macrophage priming generates atypical tumor-specific T cells that lack antitumor activity in Batf3–/– mice.
(A) Batf3–/– spleen weight after various cell depletions + CD40 agonist. (B) Batf3–/– tumor weight after various cell depletions + CD40 agonist. Each dot is an independent animal. Data are representative of n = 3–8 mice per group and are pooled from 3 independent experiments. (C) Percentage change in tumor mass in Batf3–/– mice treated with CD40 agonist and the indicated cell depletion strategies as compared with Batf3–/– mice treated with CD40 agonist only. (D) Representative Klrg1 and Lag3 staining of CD8+tetramer+ T cells from spleens and tumors from untreated Batf3+/+ mice, and Batf3+/+ and Batf3–/– mice treated with αCD40 on day 14 after tumor. (E) Quantification of D, gated on CD8+tetramer+ T cells. (F) Representative Foxp3 and Helios staining of CD8+tetramer+ T cells in spleen and tumor from untreated Batf3+/+ mice and Batf3+/+ and Batf3–/– mice treated with αCD40 on day 14 posttumor. (G) Quantification of F, gated on CD8+tetramer+ T cells. (H) Representative Klrg1 and Lag3 staining of CD8+tetramer+Foxp3+ (red) and CD8+tetramer+ Foxp3– (gray) T cells from spleens of tumor-bearing Batf3–/– mice treated with αCD40. (I) Phenotype of splenic CD8+tetramer+Foxp3+ T cells from tumor-bearing Batf3–/– mice treated with αCD40 on day 14 posttumor (day 7 after αCD40). (J) Functional analysis of Gitr+ and Gitr– CD8+ T cells following a 5-hour restimulation with CB101-109 peptide. n = 3–9 mice per group. Data are mean ± SEM and pooled from at least 2 independent experiments. Each dot is an independent animal. One-way ANOVA with a Tukey’s posttest (B, C, E, and G). Paired Student’s t test (J).

