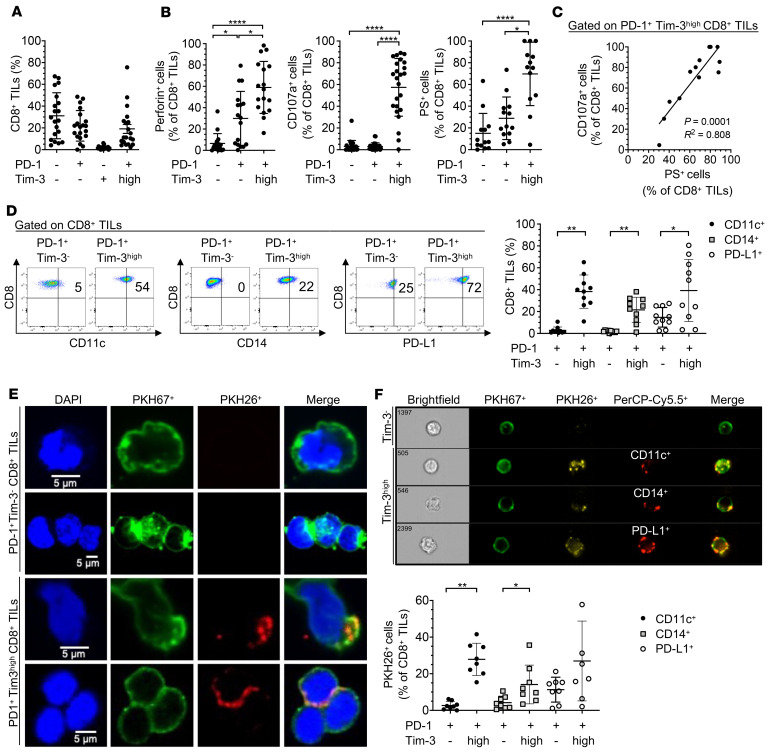
Figure 1. PD-1+Tim-3hi CD8+ TILs express myeloid markers acquired from APCs via trogocytosis in metastatic melanoma.
(A) Summary data (n = 20) showing expression of PD-1 and Tim-3 on CD8+ TILs in metastatic melanoma (MM). (B) Summary data showing frequencies of perforin+ (n = 16), CD107a+ (n = 24), and PS+ (n = 13) CD8+ TILs in MM according to PD-1 and Tim-3 expression. (C) Pooled data (n = 11) showing the correlation between CD107a and PS expression in PD-1+Tim-3hi CD8+ TILs in MM. (D) Representative dot plots (left) and summary data (right, n = 10) showing frequencies of CD11c+, CD14+, and PD-L1+ CD8+ TILs according to PD-1 and Tim-3 expression. (E) Confocal micrographs of PKH67+ PD-1+Tim-3– and PD-1+Tim-3hi CD8+ TILs coincubated for 30 minutes with autologous PKH26+CD45+CD3– cells. (F) Representative ImageStream analysis (upper) and summary data of cell frequencies with flow cytometry (lower, n = 8) showing cell surface coexpression of PKH26 and CD11c, CD14, or PD-L1 on PKH67+ PD-1+Tim-3– and PD-1+Tim-3hi CD8+ TILs after 30 minutes’ incubation with autologous PKH26+CD45+CD3– cells. P values were obtained by 1-way ANOVA followed by Holm-Šídák multiple comparisons test and Friedman’s test followed by Dunn’s multiple-comparison test (B), simple linear regression test (C), and paired t test and Wilcoxon’s matched pairs signed-rank test (D and F). *P < 0.05; **P < 0.01; ****P < 0.0001. Data indicate mean ± SD.

