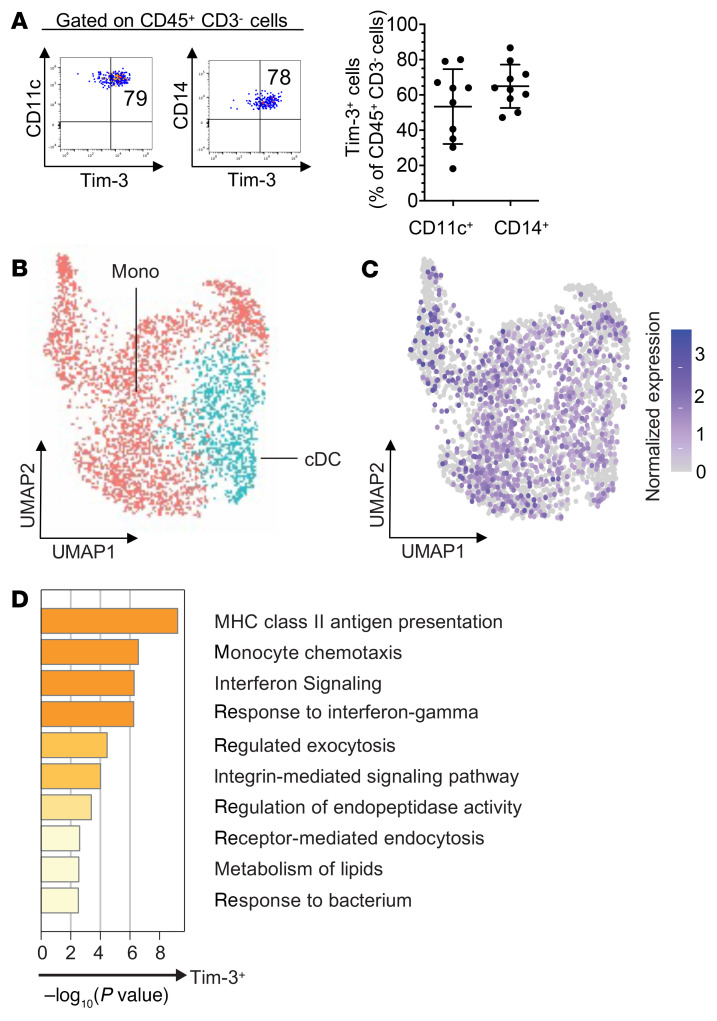
Figure 2. Transcriptomic features of Tim-3+ tumor-infiltrating myeloid cells using single-cell RNA sequencing.
(A) Summary data showing frequencies of Tim-3+CD11c+ and Tim-3+CD14+ CD45+CD3– cells in MM (n = 10). (B) Single-cell RNA sequencing (scRNA-Seq) of CD45+ cells sorted from 18 PD-1–naive MM cases. Uniform manifold approximation and projection of 3872 myeloid cells shown in dots. Monocyte (Mono) and conventional dendritic cell (cDC) clusters were identified. (C) Heatmap of normalized HAVCR2 (Tim-3) expression. (D) Summary of pathway enrichment analysis using Metascape. Myeloid cells were separated into HAVCR2+ and HAVCR2– groups.

