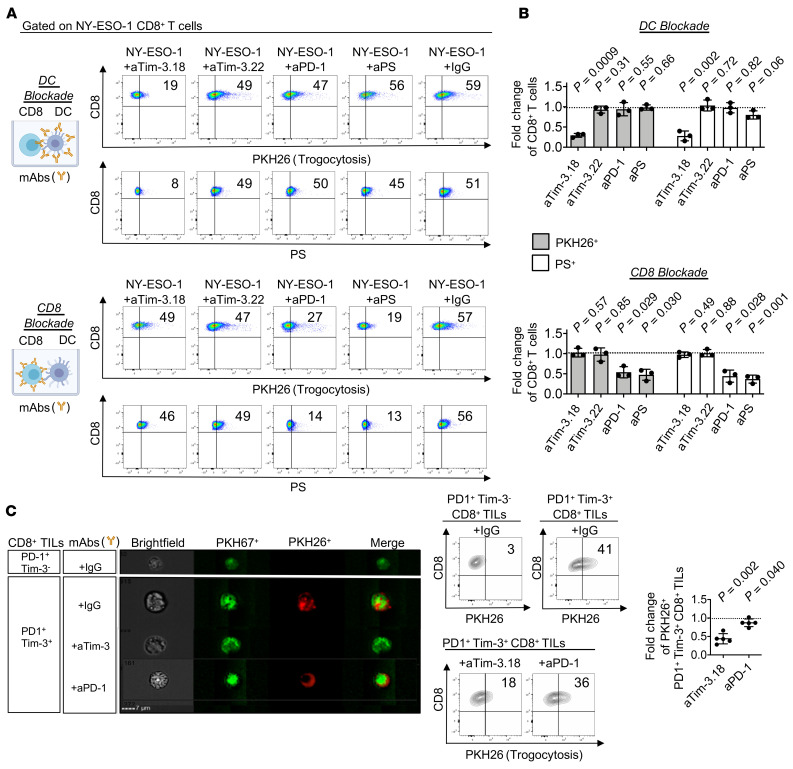
Figure 4. Tim-3 blockade acts in APCs in a PS-mediated fashion and cooperates with PD-1 blockade to decrease trogocytosis of TA-specific CD8+ T cells.
(A and B) Representative flow cytometry dot plots (A) and summary data (B) evaluating PKH26 and PS expression by CD8+ T cells. PKH26+HLA-A2+ DCs were incubated with indicated antibodies, then added to wells with NY-ESO-1 157-165–specific clone 95/3 and cognate peptide for 5 days before flow cytometry (A, upper); CD8+ T cell clone 95/3 was incubated with indicated antibodies, then added to wells with PKH26+HLA-A2+ DCs pulsed with cognate peptide for 5 days before flow cytometry (A, lower). Summary data showing fold changes of PKH26+ and PS+ CD8+ T cells upon DC blockade (B, upper) or CD8+ T cell blockade (B, lower) as compared with IgG mAbs. Data shown are representative of 3 independent experiments. (C) Representative ImageStream images (left) and flow cytometry analysis of PKH26+ CD8+ T cells (middle and right panels). PKH67+ PD-1+Tim-3– and PD-1+Tim-3+ CD8+ TILs were incubated for 30 minutes with PKH26+CD45+CD3– cells isolated from MM in the presence of indicated antibodies before analysis. Representative summary data showing fold change of PKH26+ PD-1+Tim-3+ CD8+ TILs in wells with aTim-3.18 or aPD-1 as compared with IgG control (n = 5). P values shown (B and C) were obtained from paired t tests in Supplemental Figure 3, A and B. Data indicate mean ± SD.

