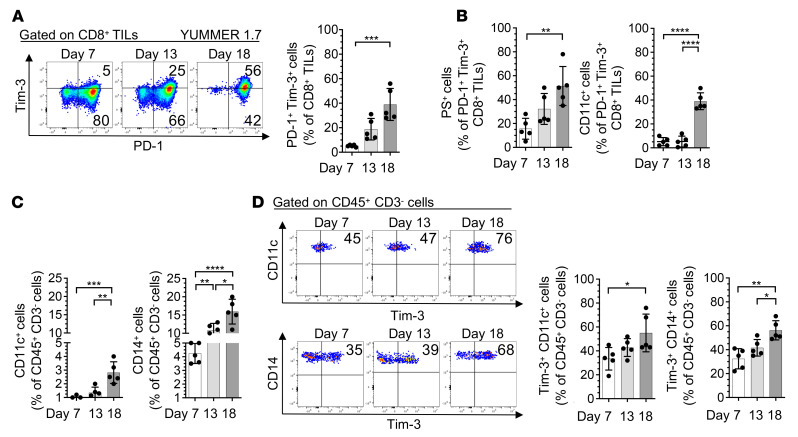
Figure 5. Frequencies of PS+, CD11c+, and CD14+ PD-1+Tim-3+ CD8+ TILs as well as Tim-3+ APCs increase in mouse melanoma upon tumor progression.
(A–D) Flow cytometry analysis of YUMMER 1.7 melanoma collected at days 7, 13, and 18 after subcutaneous implantations. (A) Representative dot plots (left) and summary data (right) showing frequencies of PD-1+Tim-3+ CD8+ TILs. (B) Summary data showing frequencies of PS+ (left) and CD11c+ (right) PD-1+Tim-3+ CD8+ TILs. (C) Summary data showing frequencies of CD11c+ (left) and CD14+ (right) CD45+CD3– cells. (D) Representative dot plots (left) and summary data (right) showing frequencies of Tim-3+CD11c+ and Tim-3+CD14+ CD45+CD3– cells. Results shown are from 1 experiment (n = 5), representative of 2 independent experiments. P values were obtained by 1-way ANOVA followed by Tukey’s multiple-comparison test (A–D). *P < 0.05; **P < 0.01; ***P < 0.001; ****P < 0.0001. Data indicate mean ± SD.

