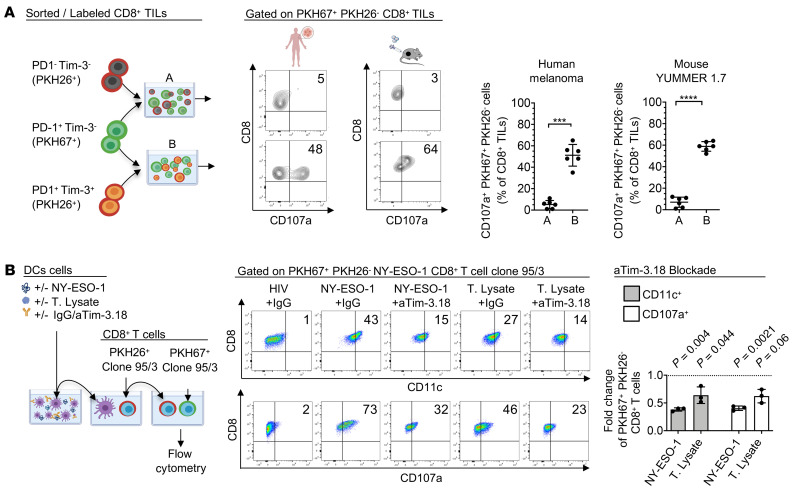
Figure 9. Trogocytosed CD8+ T cells become the target of fratricide killing.
(A) Flow cytometry data showing fratricide killing of PD-1+Tim-3+ CD8+ TILs isolated from human or mouse melanoma. PD-1+Tim-3– TILs sorted from human MM or YUMMER 1.7 (day 21 postimplantation) were labeled with PKH67 and cocultured with autologous PKH26-labeled PD-1–Tim-3– (group “A” in the figure) or PD-1+Tim-3+ (group “B” in the figure) CD8+ TILs before flow cytometry (left). Representative dot plots (middle) and summary data (right, n = 6) showing percentages of PKH67+CD107a+ CD8+ TILs. (B) Flow cytometry data showing that Tim-3 blockade impedes fratricide killing of NY-ESO-1–specific CD8+ T cells in vitro. DCs obtained from HLA-A2+ HDs were pulsed with either tumor lysate (T. Lysate) from an HLA2/NY-ESO-1+ melanoma cell line, MEL 285, or NY-ESO-1 157-165 peptide (NY-ESO-1) with aTim-3 or IgG control mAbs, then washed and cocultured with PKH26-labeled clone 95/3. PKH26+CD8+ T cells were sorted and coincubated with PKH67+ clone 95/3 for 6 hours before flow cytometry (left). Representative dot plots (middle) showing percentages of PKH67+PKH26–CD11c+ and PKH67+PKH26–CD107a+ CD8+ T cell clones and summary data of frequency fold changes upon aTim-3 as compared with IgG control mAbs (right, n = 6). Data are representative of 3 independent experiments. P values were obtained by paired t test (A). P values shown in B were obtained from paired t tests in Supplemental Figure 5B. ***P < 0.001; ****P < 0.0001. Data indicate mean ± SD.

